Forge Your Own Dev Server: Bare Metal to Watchtower
Provision a bare Debian machine into a hardened, observable development server you actually own
Your choice is remembered across quests and rewrites the commands below to match.
Every cloud you have ever rented is somebody else’s forge. This quest hands you the hammer: one bare machine, one evening, and a sequence of incantations that turns an anonymous slab of silicon into a named, hardened, observable development server that answers to you alone.
You will start from a freshly installed Debian 13 box that knows nothing about you, and finish with a machine that carries your name, refuses strangers at the gate, speaks Node and Python and Rust, serves a database to your laptop, and reports its own vital signs on a dashboard that never sleeps.
📖 The Legend Behind This Quest
Before the cloud, every engineer kept a machine under the desk. It hummed, it warmed the room, and it taught its keeper more about computing than any managed service ever would - because when it broke, no support ticket could save you.
The cloud did not make that machine obsolete; it made it optional, and therefore precious. A box you provision yourself is the only place where you can see the whole stack at once: the kernel, the package manager, the firewall table, the container runtime, the dashboard. Cloud quests teach you to describe infrastructure. This quest teaches you what you are describing.
🧪 About the Screenshots in This Quest
Every terminal image below is a real capture from a real run, not a mock-up. The whole sequence was executed against a clean debian:trixie-slim container - a disposable stand-in for a fresh Debian 13 install - and the service-stack chapter ran against a live Docker daemon. The transcripts were recorded as the commands executed and then rendered to images, the same way IT-Journey’s own quest-walkthrough tooling seals its evidence.
That honesty cuts both ways: where the sandbox could not reproduce something a real machine does, this quest says so instead of faking it. Look for the ⚠️ Sandbox note callouts.
🎯 Quest Objectives
By the time you complete this journey, you will have mastered:
Primary Objectives (Required for Quest Completion)
- Reconnaissance - Read a machine’s identity, capacity, and storage before changing anything
- The Foundation - Bring the system current and install a deliberate, minimal toolset
- Identity and Access - Name the host, create your user, and grant sudo safely
- The Perimeter - Close every port by default and open only what the LAN needs
- Toolchains - Install per-user Node, Python, and Rust that survive OS upgrades
- The Service Stack - Run Postgres, Redis, and a database UI as restart-safe containers
- The Console Mirror - Share one terminal between the physical monitor and your SSH session
- The Watchtower - Write a health check and put it on a dashboard that refreshes itself
- The Watchtower’s Eye - Run btop as your primary instrument, and fix it when it refuses to draw
- The Operator’s Toolkit - Drive containers, repositories and disk usage from purpose-built TUIs
Secondary Objectives (Bonus Achievements)
- Idempotent Scripts - Capture the whole build as scripts you can re-run without harm
- Health History - Log every check to disk so you can answer “when did this start?”
- Wake Discipline - Stop the box from sleeping, and learn to wake it when it does
- Release-Tarball Installs - Install tools that never shipped as Debian packages
Mastery Indicators
You’ll know you’ve truly mastered this quest when you can:
- Explain every line of your firewall table without looking it up
- Add a new check to the health script and see it on the dashboard within one refresh
- Rebuild the entire box from your scripts onto a second machine
- Diagnose a check that reports the wrong verdict because of the user it runs as
- Explain why btop refuses to draw, from the error alone, in under a minute
🗺️ Quest Prerequisites
📋 Knowledge Requirements
- Completion of Bash Scripting - you will write and read shell scripts throughout
- Comfort with the terminal: navigation, file editing, reading exit codes
- Container basics, ideally Docker Compose Orchestration
🛠️ System Requirements
- A machine to sacrifice: an old desktop, a spare laptop, a VM, or a cloud instance
- Debian 13 (trixie) freshly installed, with network access
- Physical or SSH access with an account that can
sudo - A second computer on the same network to connect from
🧠 Skill Level Indicators
- You would rather understand a machine than click through a control panel
- You can read an error, form a hypothesis, and test it without panic
🌍 Choose Your Adventure Platform
The server is Debian either way. This section is about the machine you drive it from.
🍎 macOS Kingdom Path
# Reach the box and give it a memorable name in your SSH config
ssh-keygen -t ed25519 -C "$(whoami)@$(hostname)"     # if you have no key yet
ssh-copy-id forge@192.168.4.89                        # push your public key
printf 'Host forge\n  HostName 192.168.4.89\n  User forge\n' >> ~/.ssh/config
ssh forge
🪟 Windows Empire Path
# OpenSSH ships with Windows 10+; WSL2 also works and behaves like the Linux path
ssh-keygen -t ed25519
type $env:USERPROFILE\.ssh\id_ed25519.pub | ssh forge@192.168.4.89 "mkdir -p ~/.ssh && cat >> ~/.ssh/authorized_keys"
ssh forge@192.168.4.89
🐧 Linux Territory Path
ssh-keygen -t ed25519
ssh-copy-id forge@192.168.4.89
ssh forge@192.168.4.89
☁️ Cloud Realms Path
# No spare hardware? Rent the metal for an hour - every command below is identical.
# Any Debian 13 image on any provider works; a 2 vCPU / 4 GB instance is plenty.
ssh admin@<instance-public-ip>
🧙♂️ Chapter 1: Reconnaissance - Know the Machine
⚔️ Skills You’ll Forge in This Chapter
- Reading a machine’s true identity before trusting any assumption about it
- Establishing the baseline you will compare against for the rest of the build
Never change a system you have not measured. Four commands tell you what you are standing on: which Debian, which kernel and architecture, how much compute and memory, and how much disk you have to spend.
cat /etc/os-release | head -3      # which distribution and release
uname -srm                          # kernel version and CPU architecture
nproc                               # how many cores you can spend
grep -E "^(MemTotal|MemAvailable)" /proc/meminfo   # memory, before anything is running
df -h /                             # room on the root filesystem
id && hostname                      # who you are and where you are
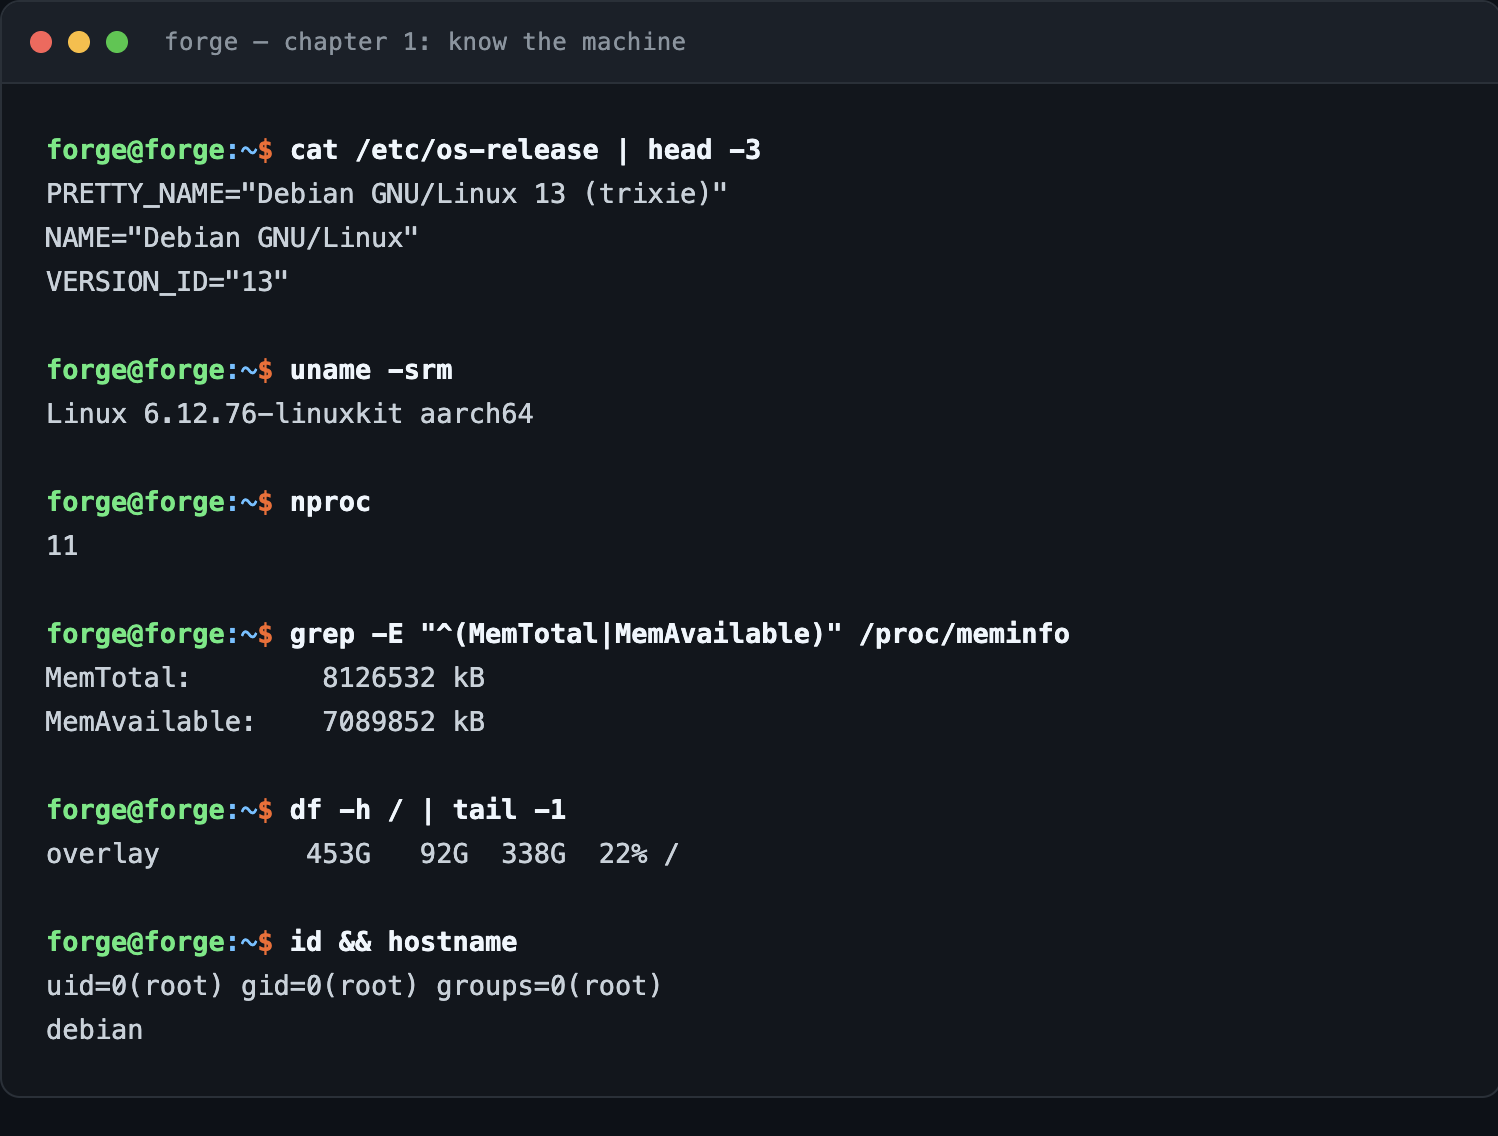
Note what the machine calls itself right now: debian, the name the installer gave it. By the end of Chapter 3 it will answer to a name you chose.
Why
/proc/meminfoand notfree -h? On a minimal install,freemay not exist yet - it arrives with theprocpspackage in the next chapter./proc/meminfois provided by the kernel itself and is always there. Reconnaissance should never depend on software you have not installed.
🔍 Knowledge Check: Reconnaissance
- Can you state your machine’s architecture and why it determines which binaries you can install?
- Which number here would make you reconsider running a database on this box?
🧙♂️ Chapter 2: The Foundation - Bring the System Current
⚔️ Skills You’ll Forge in This Chapter
- Distinguishing “update” from “upgrade” and knowing when each matters
- Choosing a deliberate toolset instead of installing a distribution’s kitchen sink
sudo apt-get update                 # refresh the package lists
sudo apt-get upgrade -y             # bring installed packages current

# One deliberate toolset: shell, multiplexer, editor, search, JSON, process view
sudo apt-get install -y \
  sudo curl git build-essential zsh tmux vim \
  ripgrep fd-find jq htop ca-certificates unzip procps iproute2 less
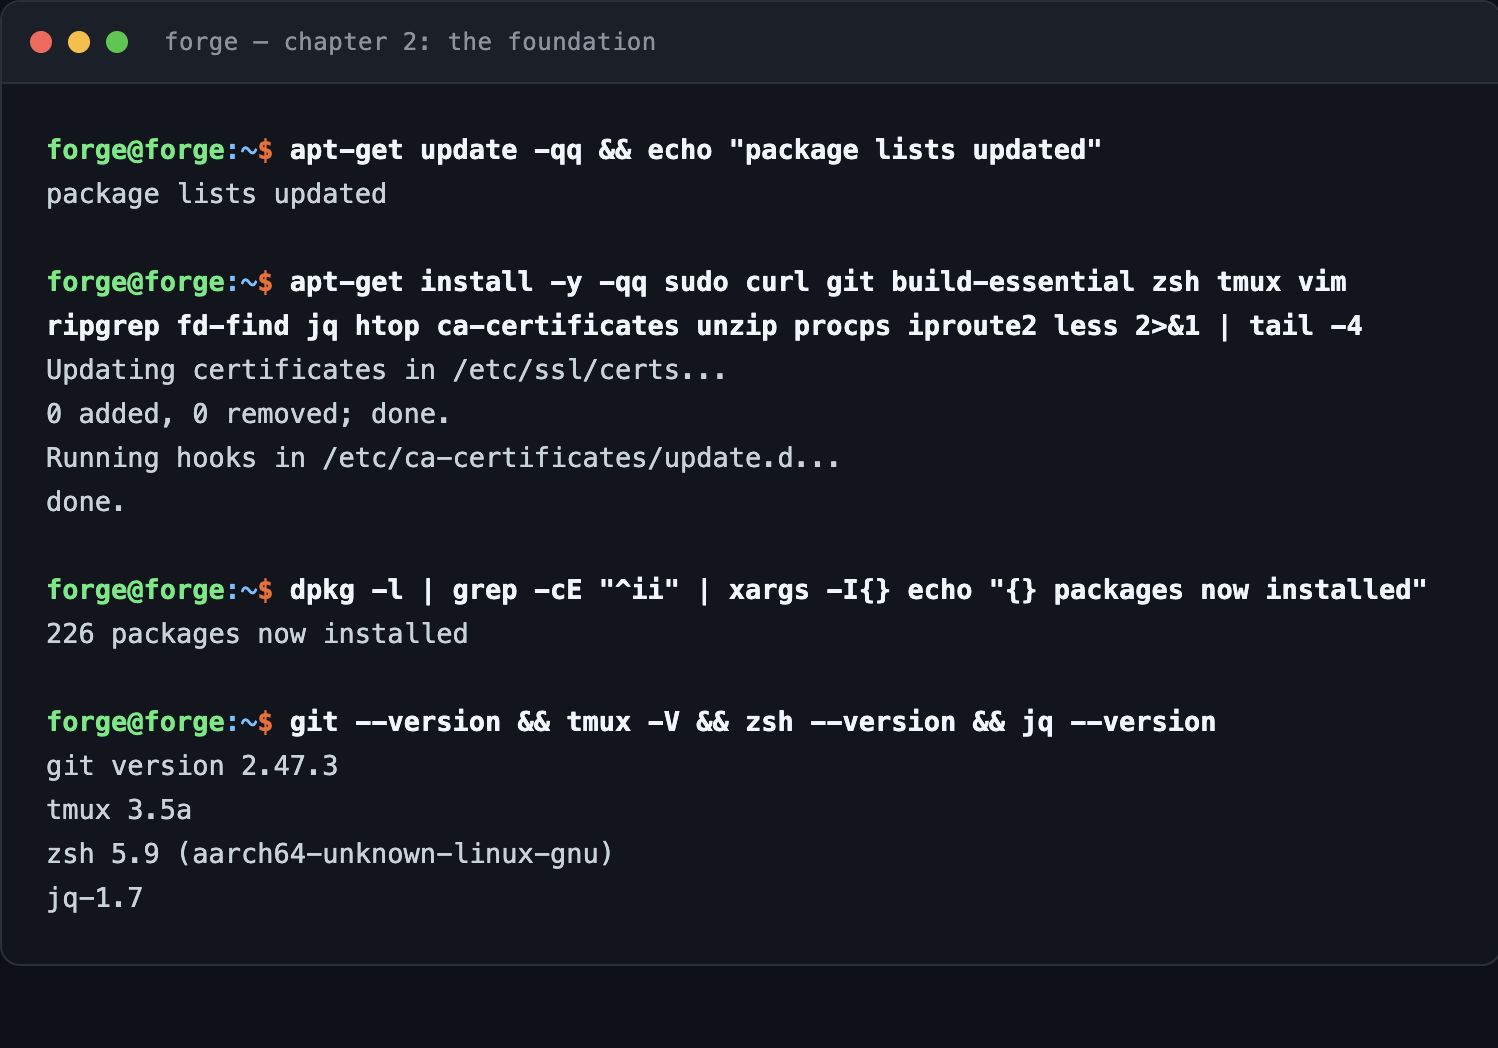
Always finish an install by proving the tools answer:
git --version && tmux -V && zsh --version && jq --version
ripgrepandfd-findare the modern replacements forgrep -randfind. On Debian thefdbinary installs asfdfindto avoid a name collision; alias it withalias fd=fdfindin your shell config.
🔍 Knowledge Check: The Foundation
- What is the difference between
apt-get updateandapt-get upgrade? - Why install
ca-certificatesbefore fetching anything over HTTPS?
🧙♂️ Chapter 3: Identity and the Keys - Name the Machine, Make Your User
⚔️ Skills You’ll Forge in This Chapter
- Renaming a host completely, including the loopback mapping most guides forget
- Creating a user with sudo rights and validating the sudoers file before trusting it
A machine called debian is a machine you will confuse with the next one. Rename it - and remember that the hostname lives in two places.
sudo hostnamectl set-hostname forge          # the running system and /etc/hostname
printf "127.0.1.1\tforge\n" | sudo tee -a /etc/hosts   # the loopback mapping
Skip that second line and every sudo call greets you with unable to resolve host forge - a warning that means your name resolution disagrees with your identity.
sudo useradd -m -s /bin/zsh -G sudo forge    # home directory, zsh, sudo group
echo "forge ALL=(ALL) NOPASSWD: ALL" | sudo tee /etc/sudoers.d/forge
sudo chmod 440 /etc/sudoers.d/forge
sudo visudo -c -f /etc/sudoers.d/forge       # ALWAYS validate before logging out
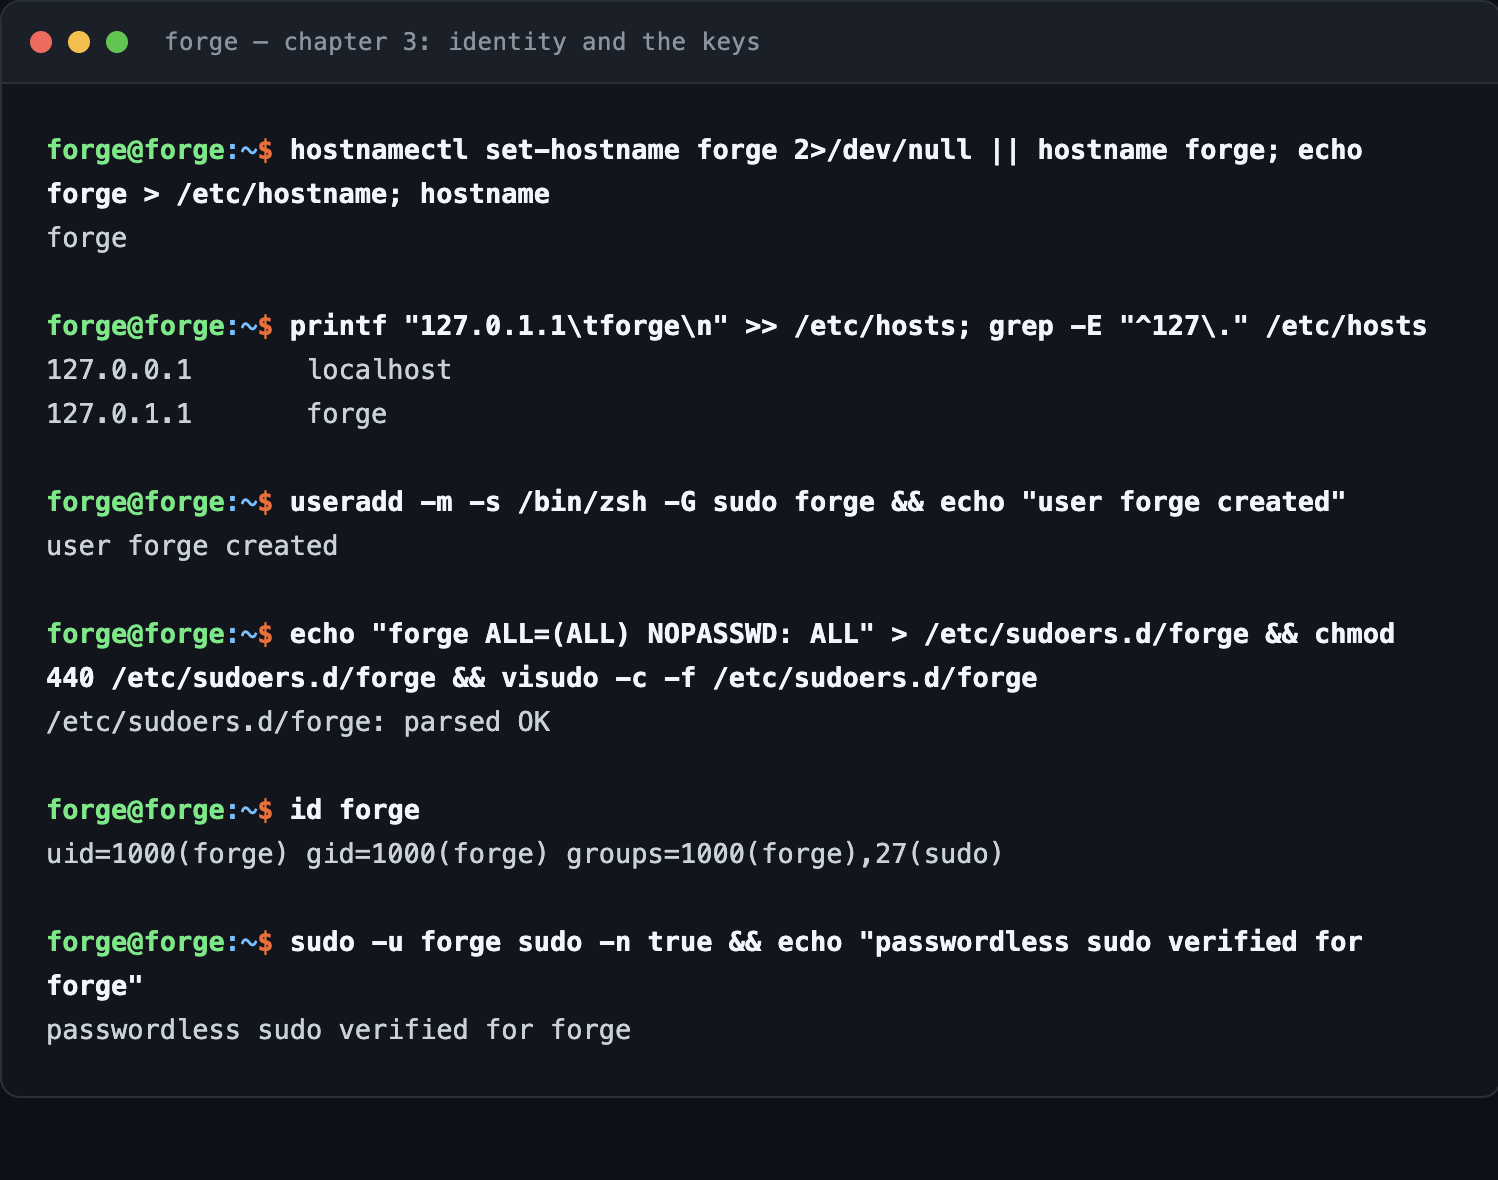
The
visudo -chabit will save you. A malformed sudoers file locks every user out of root on a machine you may only be able to reach over SSH. Validating costs one second; recovering costs a rescue boot.
🔍 Knowledge Check: Identity
- Why does the hostname need to be set in
/etc/hostsas well as/etc/hostname? - What is the trade-off of
NOPASSWD: ALLon a single-user home server versus a shared one?
🧙♂️ Chapter 4: The Perimeter - Deny by Default
⚔️ Skills You’ll Forge in This Chapter
- Building a firewall from a default-deny posture rather than patching holes shut
- Scoping every rule to the network that should have it, not to the whole internet
The correct starting posture is nothing gets in. Then you open exactly what you need, to exactly who needs it.
sudo apt-get install -y ufw openssh-server

sudo ufw default deny incoming        # the posture that matters
sudo ufw allow from 192.168.4.0/24 to any port 22   proto tcp comment "ssh from LAN"
sudo ufw allow from 192.168.4.0/24 to any port 5432 proto tcp comment "postgres from LAN"
sudo ufw --force enable
sudo ufw status verbose
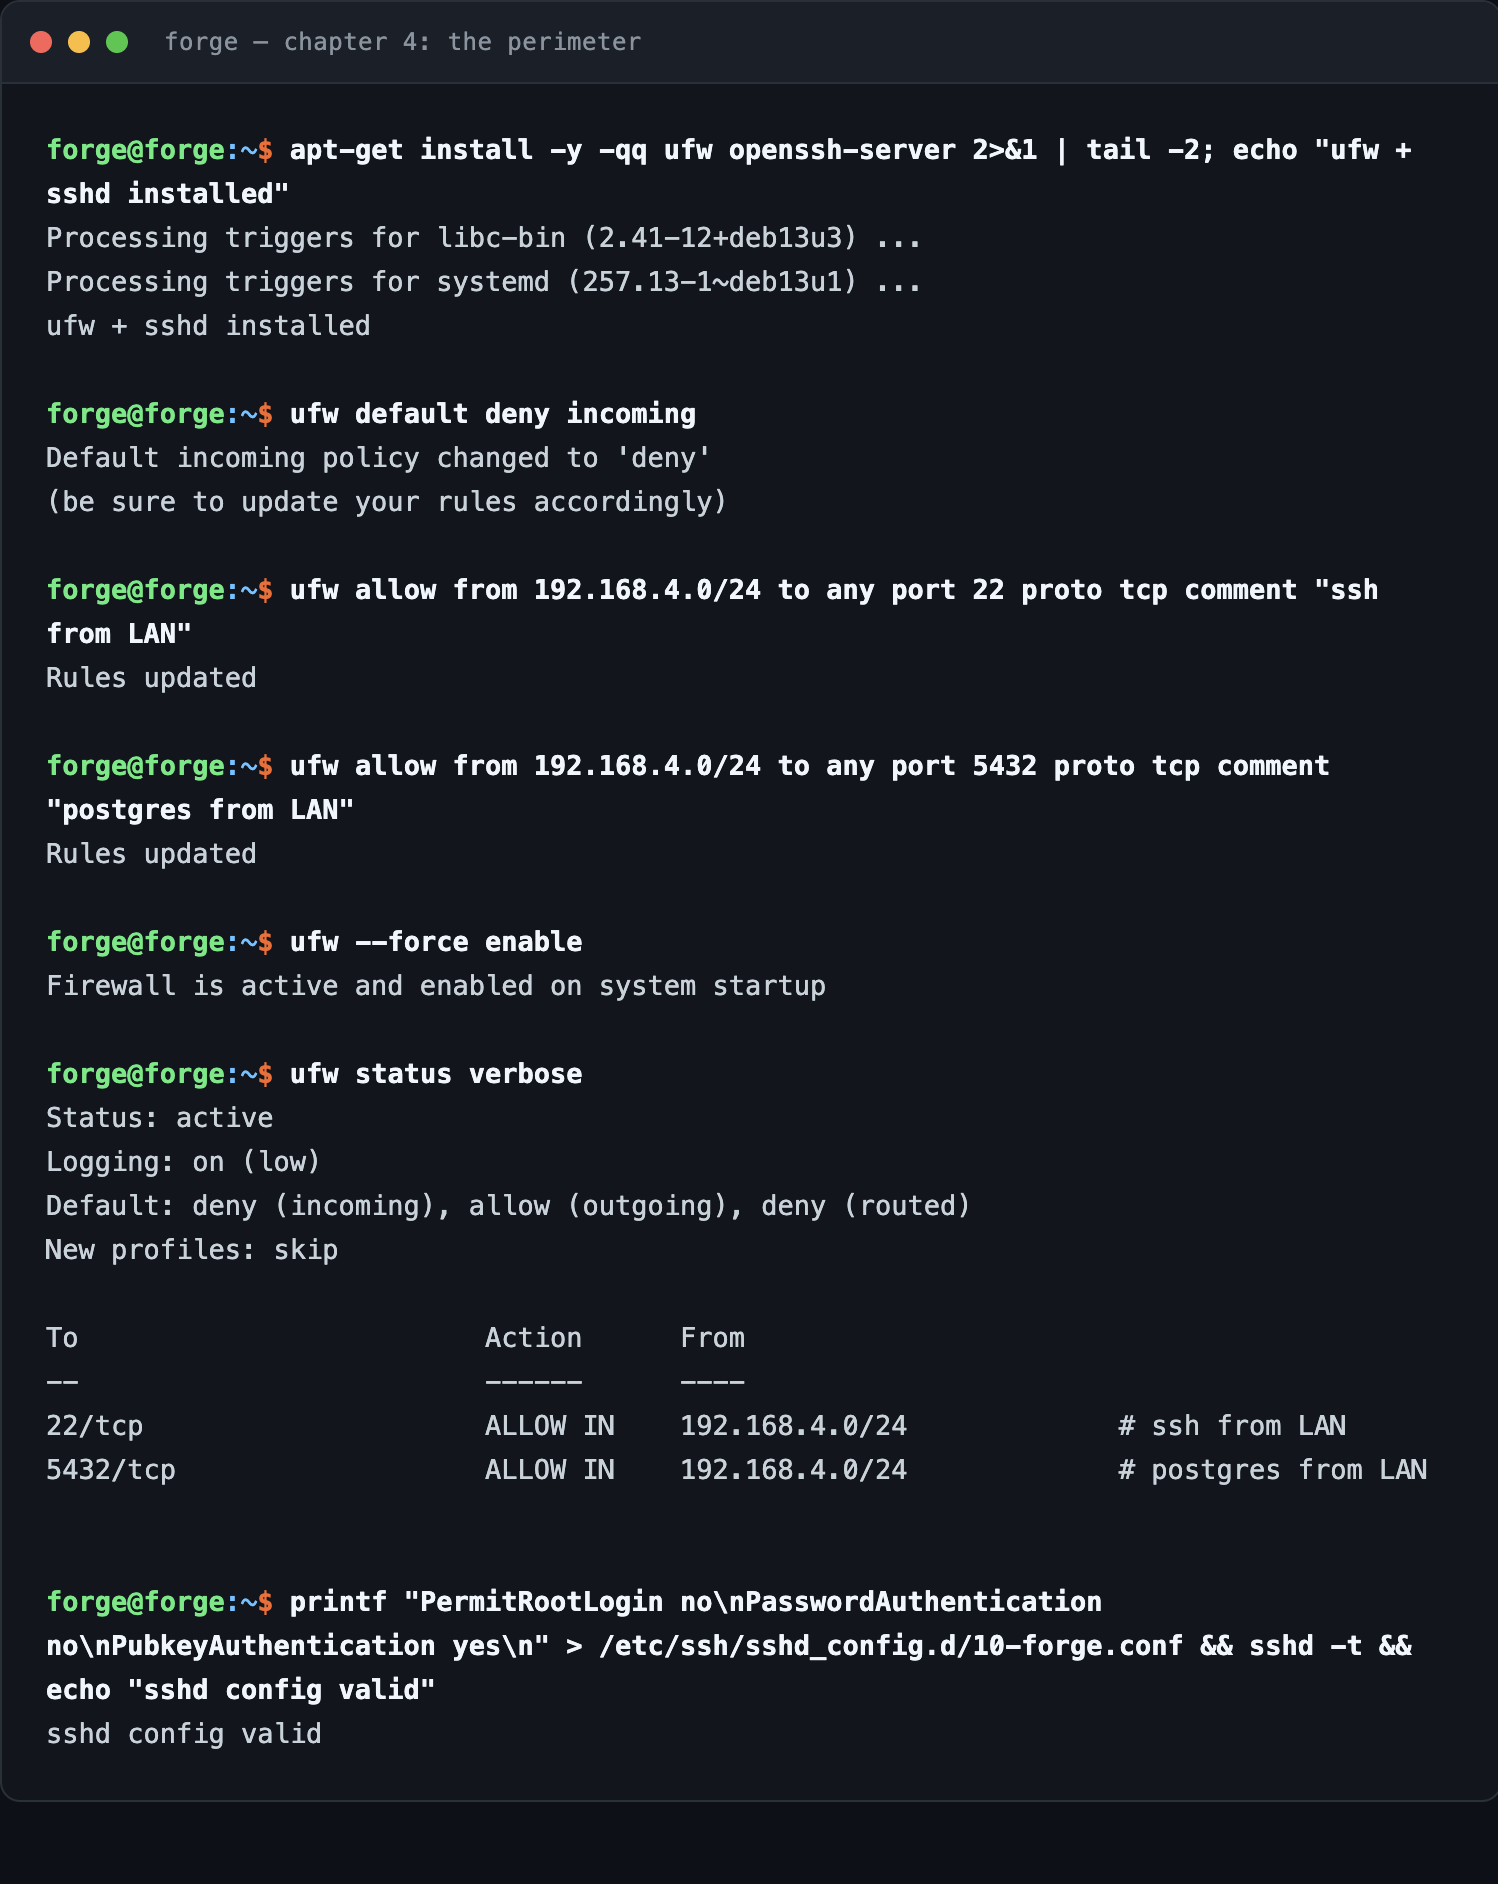
Notice the shape of those rules: not allow 22, but allow from 192.168.4.0/24 ... port 22. The first opens SSH to the entire internet; the second opens it to your house. Replace 192.168.4.0/24 with your own subnet - ip -4 addr | grep inet will tell you what it is.
Then harden SSH itself, and validate the config before restarting the daemon you are connected through:
printf "PermitRootLogin no\nPasswordAuthentication no\nPubkeyAuthentication yes\n" \
  | sudo tee /etc/ssh/sshd_config.d/10-forge.conf
sudo sshd -t && echo "sshd config valid"     # never skip this
sudo systemctl reload ssh
Copy your public key to the box before disabling password authentication. Do it in the other order and you have locked yourself out of a machine that now refuses passwords. Use
ssh-copy-id forge@<ip>from your laptop first, and keep the current session open until a second, new session succeeds.
🔍 Knowledge Check: The Perimeter
- Why is
default deny incomingsafer than adding deny rules for known-bad ports? - What does
sshd -tcheck, and what happens if you reload a broken config without it?
🧙♂️ Chapter 5: The Toolchains - Per-User Languages
⚔️ Skills You’ll Forge in This Chapter
- Installing language runtimes per user instead of fighting the system package manager
- Understanding why version managers outlive the OS release you installed them on
Debian’s nodejs package tracks Debian’s release, not your project’s needs. Install runtimes per user, with managers that let each repository pin its own version.
# Node, via fnm - fast, and switches automatically per directory
curl -fsSL https://fnm.vercel.app/install | bash -s -- --skip-shell
export PATH="$HOME/.local/share/fnm:$PATH"; eval "$(fnm env)"
fnm install --lts && fnm default lts-latest

# Python, via uv - resolver, venv manager, and interpreter installer in one binary
curl -LsSf https://astral.sh/uv/install.sh | sh
export PATH="$HOME/.local/bin:$PATH"
uv python install 3.13

# Rust, via rustup
curl --proto "=https" --tlsv1.2 -sSf https://sh.rustup.rs | sh -s -- -y --profile minimal
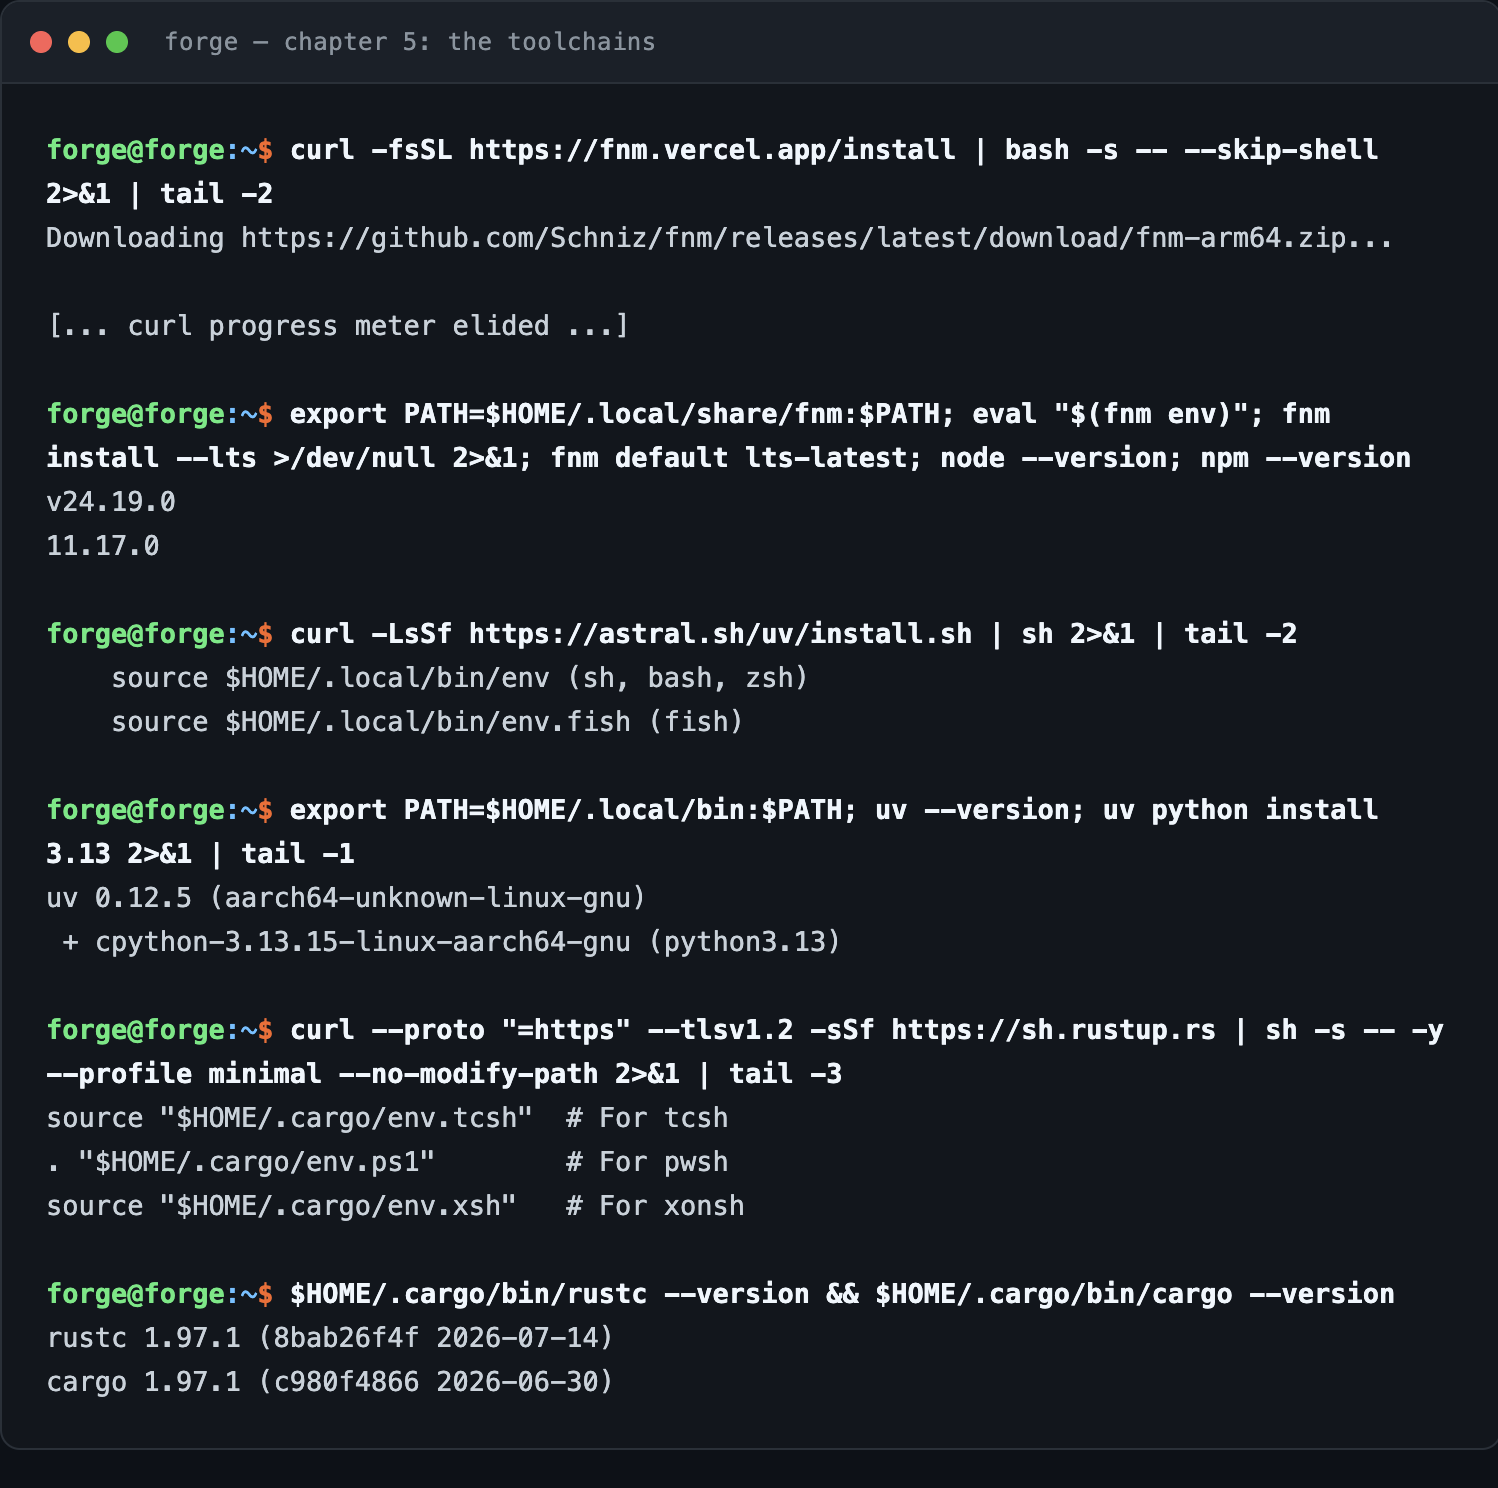
⚠️ Sandbox note: the first attempt at the rustup line failed with
zsh:1: https not found. In zsh, an unquoted=httpstriggers equals expansion, which tries to resolvehttpsas a command. Quoting it ---proto "=https"- fixes it. The command above is the corrected one, and it is a genuine difference between running installers in bash and in zsh.
Persist the paths so new shells inherit them:
cat >> ~/.zshrc <<'EOF'
export PATH="$HOME/.local/share/fnm:$HOME/.local/bin:$HOME/.cargo/bin:$PATH"
eval "$(fnm env --use-on-cd)"      # switch Node version on cd, per .node-version
EOF
🔍 Knowledge Check: Toolchains
- Why does a per-user toolchain survive a distribution upgrade better than an apt-installed one?
- What does
fnm env --use-on-cdchange about entering a project directory?
🧙♂️ Chapter 6: The Service Stack - Databases as Cattle
⚔️ Skills You’ll Forge in This Chapter
- Declaring backing services as restart-safe containers instead of hand-installed daemons
- Using health checks so “running” means “actually answering”
Every project wants a database. Installing Postgres onto the host makes it the host’s Postgres forever. Declare it instead, in ~/dev/stack/docker-compose.yml:
services:
  postgres:
    image: postgres:17-alpine
    container_name: forge-postgres
    restart: unless-stopped
    environment:
      POSTGRES_USER: dev
      POSTGRES_PASSWORD: dev
      POSTGRES_DB: dev
    ports: ["5432:5432"]
    volumes: ["pgdata:/var/lib/postgresql/data"]
    healthcheck:
      test: ["CMD-SHELL", "pg_isready -U dev"]
      interval: 10s
      timeout: 5s
      retries: 5

  redis:
    image: redis:8-alpine
    container_name: forge-redis
    restart: unless-stopped
    ports: ["6379:6379"]
    command: ["redis-server", "--appendonly", "yes"]
    healthcheck:
      test: ["CMD", "redis-cli", "ping"]
      interval: 10s
      timeout: 3s
      retries: 5

  adminer:
    image: adminer:latest
    container_name: forge-adminer
    restart: unless-stopped
    ports: ["8080:8080"]
    depends_on: [postgres]

volumes:
  pgdata:
cd ~/dev/stack && docker compose up -d
docker compose ps                    # look for "(healthy)", not merely "Up"
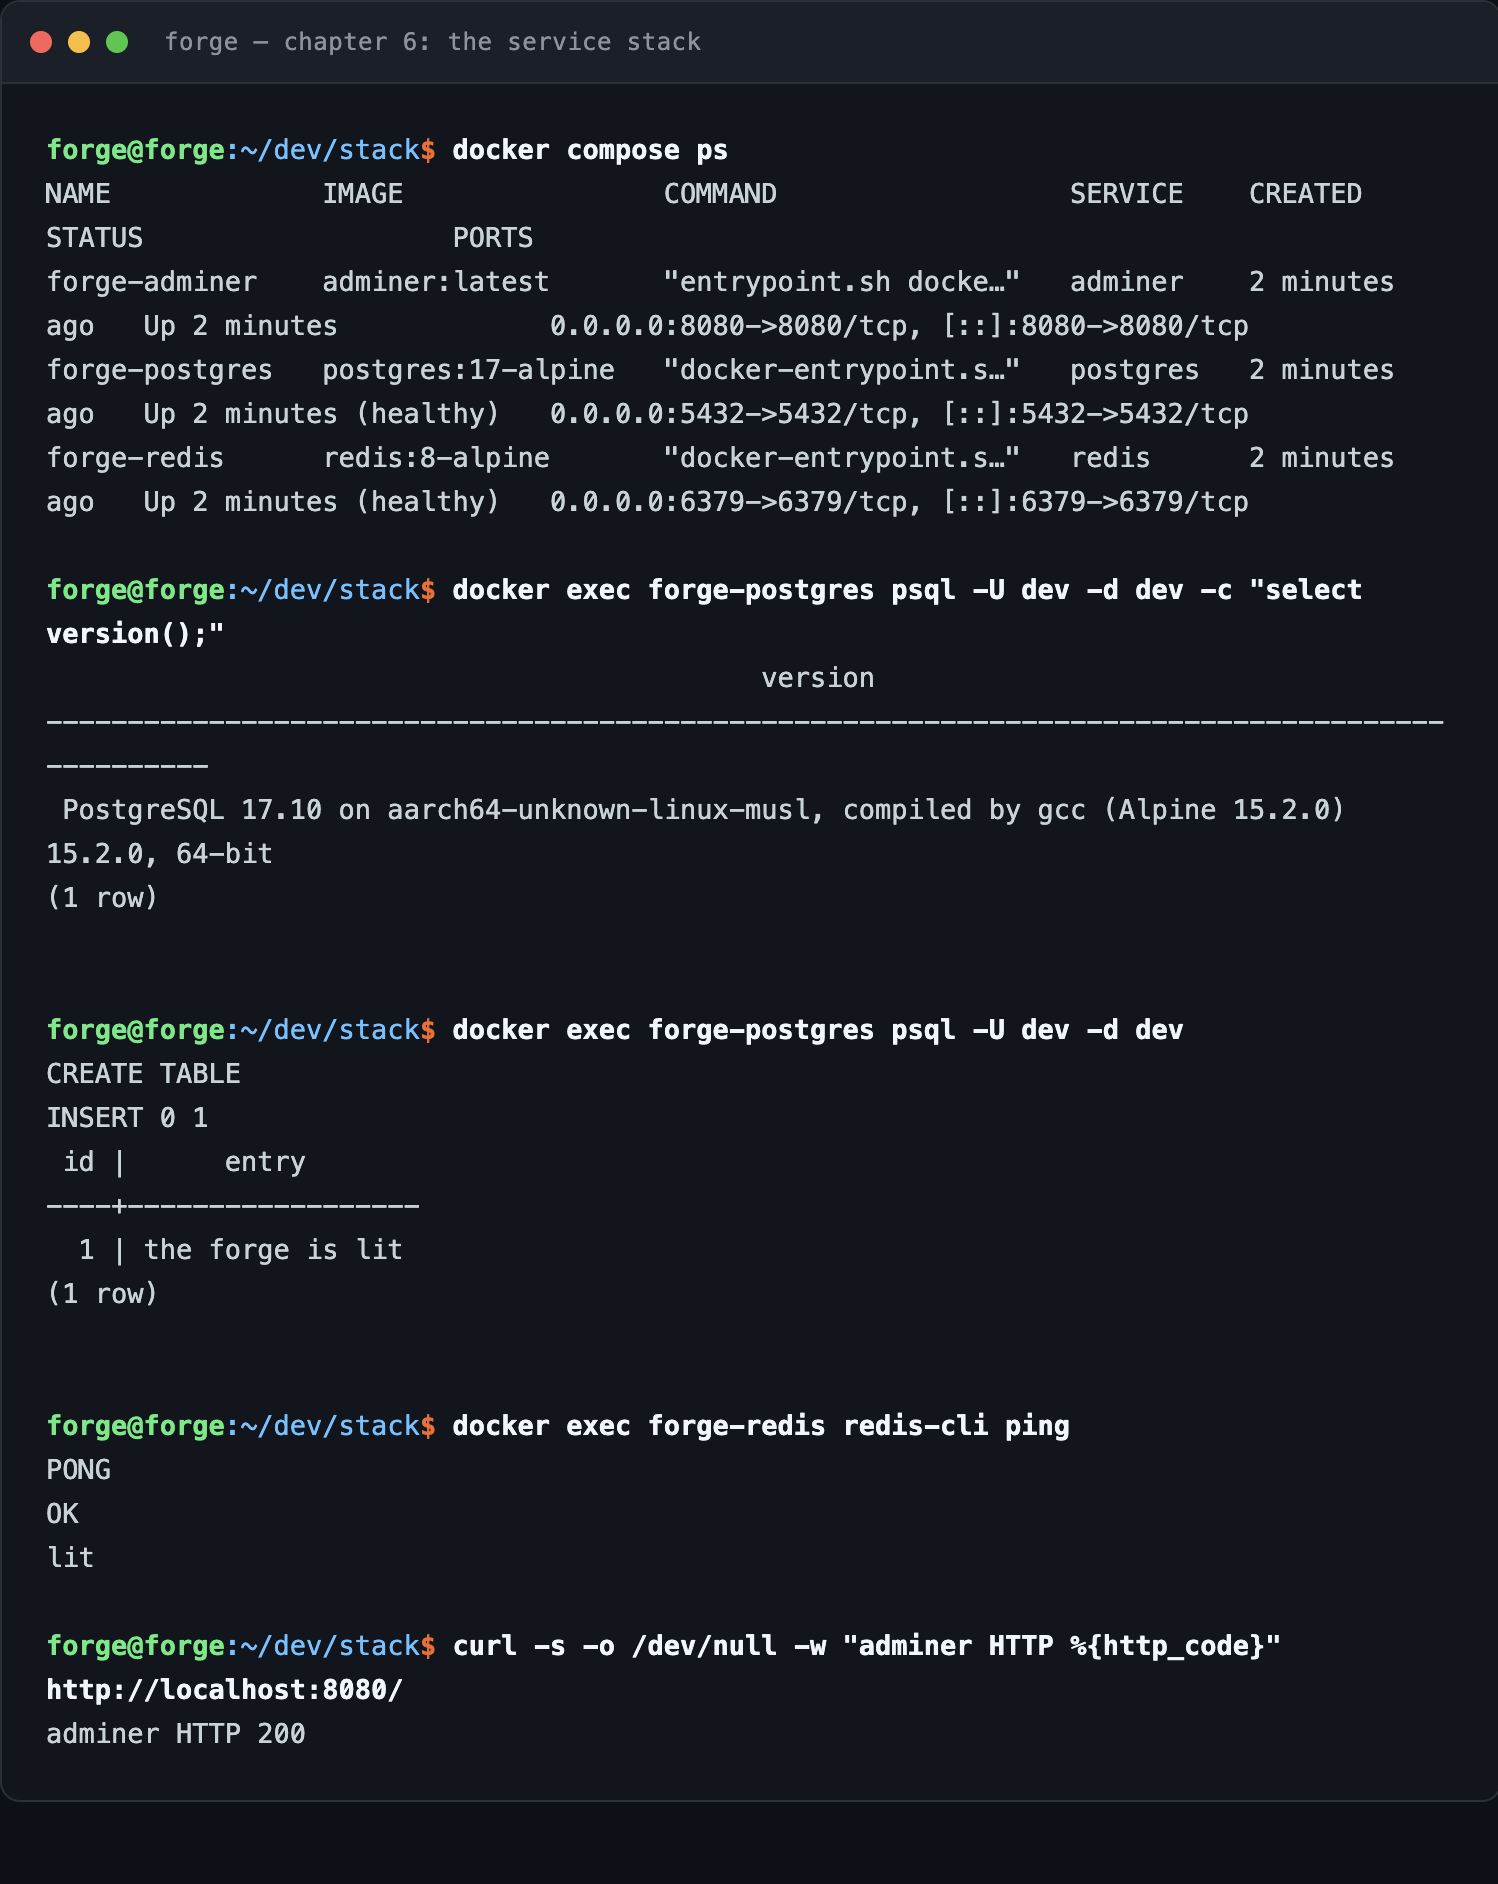
restart: unless-stopped is what makes this a server rather than a laptop: the stack returns by itself after a power cut, and stays down only when you deliberately stop it.
🔍 Knowledge Check: The Service Stack
- What does a health check tell you that a “Up 2 minutes” status does not?
- Why is the named
pgdatavolume the difference between a database and a scratch pad?
🧙♂️ Chapter 7: The Console Mirror - One Terminal, Two Windows
⚔️ Skills You’ll Forge in This Chapter
- Sharing a single tmux session between the physical console and remote clients
- Reasoning about tmux clients, sessions, and who controls the window size
Here is the trick that turns a headless box into a machine you can watch: instead of the physical monitor and your SSH session being separate terminals, make them two clients of one session. What you type over SSH appears on the monitor, live.
sudo tee /usr/local/bin/forge-console >/dev/null <<'EOF'
#!/usr/bin/env bash
# forge-console — attach to the shared console session, or create it.
SESSION="${FORGE_SESSION:-console}"
if tmux has-session -t "$SESSION" 2>/dev/null; then
  exec tmux attach-session -t "$SESSION"   # join what the monitor shows
else
  exec tmux new-session -s "$SESSION" -n shell
fi
EOF
sudo chmod +x /usr/local/bin/forge-console
Point the machine’s console autologin at forge-console, and add it to your ~/.zshrc guarded by an escape hatch, so an SSH login joins the same session:
# in ~/.zshrc — join the shared console unless explicitly opted out
[[ -z "$TMUX" && -n "$SSH_CONNECTION" && -z "$NOTMUX" ]] && exec forge-console
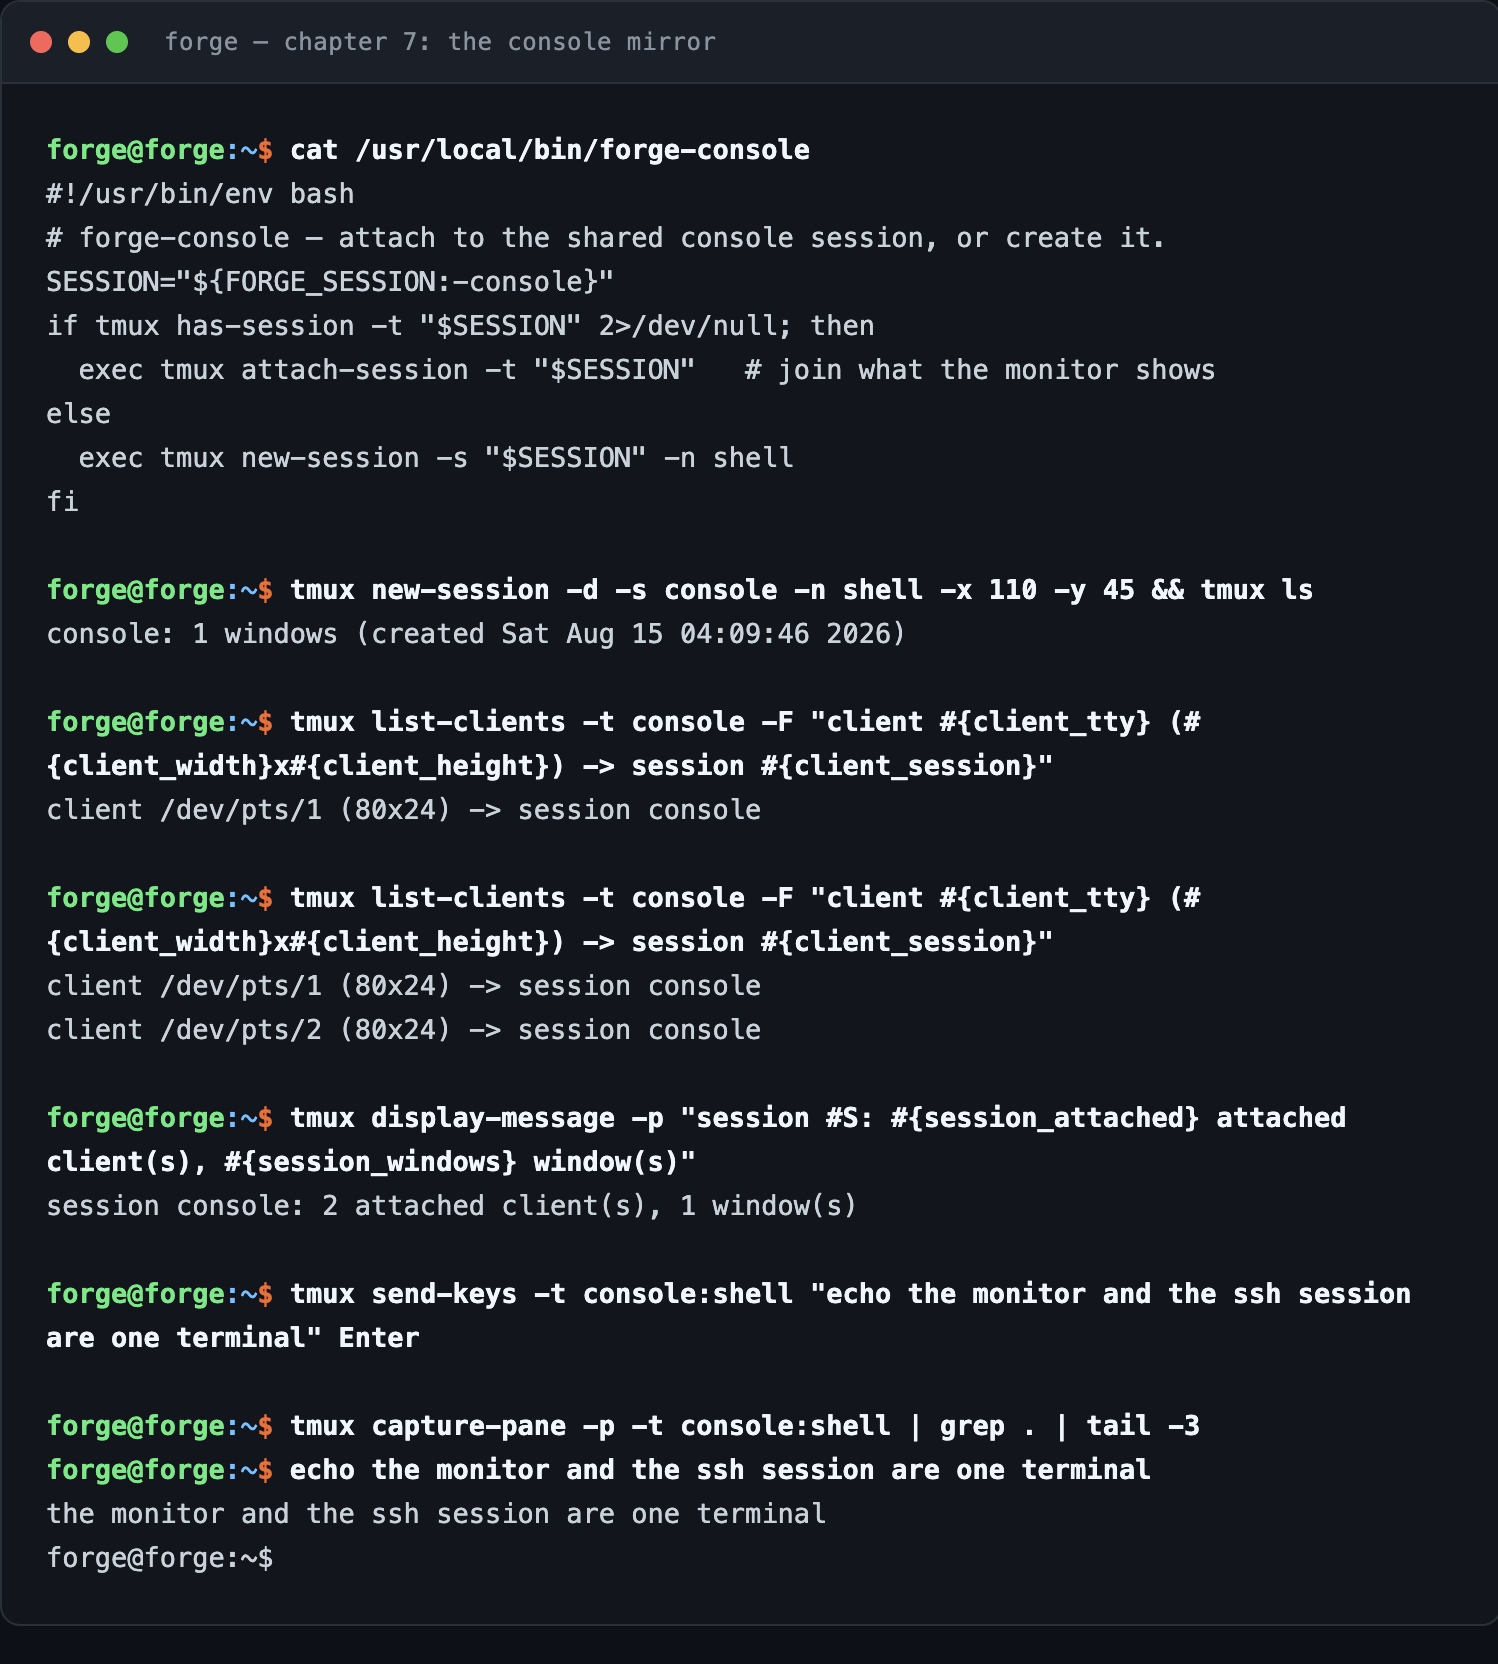
Two clients, one session - /dev/pts/1 is the monitor, /dev/pts/2 is your laptop, and both render the same pane. Keep the escape hatch: ssh -t forge NOTMUX=1 zsh gives you a private shell when you do not want an audience.
⚠️ Sandbox note: tmux sizes a window to its smallest attached client. Two 80x24 clients squeeze the dashboard you are about to build into 80x24, whatever the monitor’s real resolution. Detaching the demo clients before building it - or attaching from a maximized terminal - gives the panes room. An attempt to force this with
set-option -g window-size manualcrashed the tmux server outright in the sandbox; releasing the clients is the safer move.
🔍 Knowledge Check: The Console Mirror
- What is the difference between a tmux session, window, pane, and client?
- Why does the
NOTMUXescape hatch belong in the shell config from day one?
🧙♂️ Chapter 8: The Watchtower - Health You Can See
⚔️ Skills You’ll Forge in This Chapter
- Writing a health check that renders a verdict instead of dumping raw numbers
- Assembling a self-refreshing dashboard, and logging history for later questions
A monitoring stack you have to interpret is not monitoring. Write a script that renders a verdict - OK, WARN, or CRIT - for each thing that can go wrong.
sudo tee /usr/local/bin/forge-health >/dev/null <<'EOF'
#!/usr/bin/env bash
# forge-health — one-screen health verdict for the dev box.
G=$'\e[32m'; Y=$'\e[33m'; R=$'\e[31m'; D=$'\e[2m'; N=$'\e[0m'
ok()   { printf '%s[ OK ]%s %-11s %s\n' "$G" "$N" "$1" "$2"; }
warn() { printf '%s[WARN]%s %-11s %s\n' "$Y" "$N" "$1" "$2"; }
crit() { printf '%s[CRIT]%s %-11s %s\n' "$R" "$N" "$1" "$2"; }

printf 'forge health %s%s - up %s%s\n\n' "$D" "$(date '+%Y-%m-%d %H:%M')" \
  "$(uptime -p | sed 's/^up //')" "$N"

cores=$(nproc); load=$(awk '{print $1}' /proc/loadavg)
awk -v l="$load" -v c="$cores" 'BEGIN{exit !(l > c)}' \
  && warn load "$load (cores: $cores)" || ok load "$load (cores: $cores)"

read -r total avail <<<"$(free -m | awk '/^Mem:/{print $2, $7}')"
pct=$(( avail * 100 / total ))
[ "$pct" -lt 15 ] && crit memory "${pct}% available of ${total}Mi" \
                  || ok memory "${pct}% available of ${total}Mi"

use=$(df -P / | awk 'NR==2{print $5}' | tr -d '%'); free_h=$(df -Ph / | awk 'NR==2{print $4}')
[ "$use" -gt 85 ] && warn disk "/ ${use}% used (${free_h} free)" \
                  || ok disk "/ ${use}% used (${free_h} free)"

# NOTE: ufw status needs root. The dashboard runs as your unprivileged user,
# so ask via `sudo -n` or every refresh reports a false CRIT.
if sudo -n ufw status 2>/dev/null | grep -q "Status: active"; then
  ok firewall "ufw active"
else
  crit firewall "ufw INACTIVE"
fi

ok processes "$(ps -e --no-headers | wc -l | tr -d ' ') running"
EOF
sudo chmod +x /usr/local/bin/forge-health
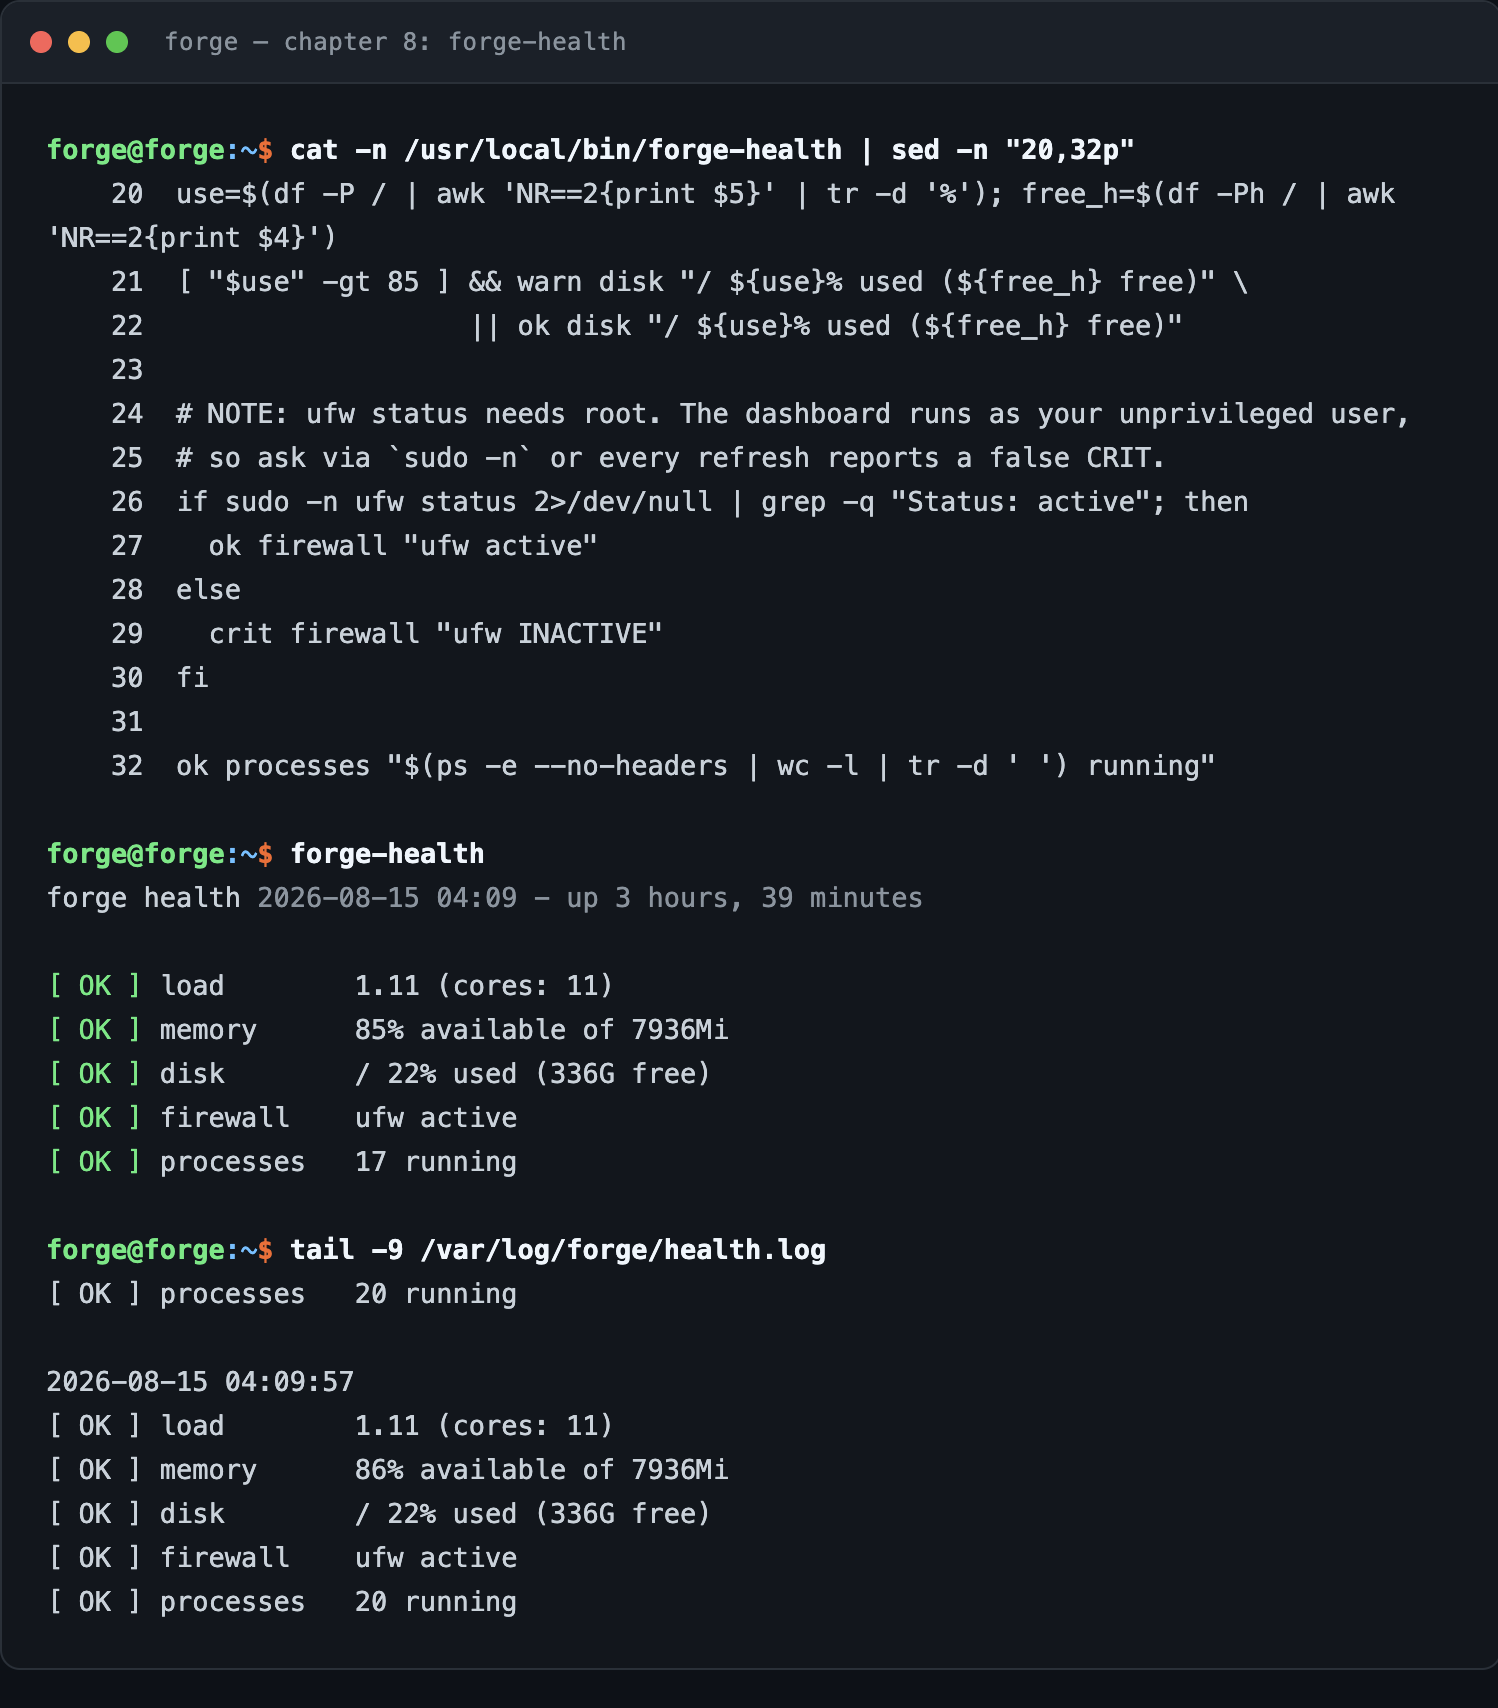
That sudo -n in the firewall check is the whole lesson of this chapter, and it was a real bug caught during this build. The first version called ufw status directly. Run by hand it printed [ OK ] firewall ufw active; run on the dashboard as the unprivileged forge user it printed [CRIT] firewall ufw INACTIVE - every five seconds, forever. The check was not measuring the firewall. It was measuring who was asking.
Now assemble the dashboard as a window in the shared console session, so it lives on the monitor:
sudo tee /usr/local/bin/forge-dash >/dev/null <<'EOF'
#!/usr/bin/env bash
# forge-dash — build the monitoring dashboard window in the console session.
SESSION="${FORGE_SESSION:-console}"
tmux has-session -t "$SESSION" 2>/dev/null || tmux new-session -d -s "$SESSION" -n shell
tmux kill-window -t "$SESSION:dash" 2>/dev/null
tmux new-window   -d -t "$SESSION" -n dash 'top -d 5'
tmux split-window -v -t "$SESSION:dash"    'watch -tn 5 forge-health'
tmux split-window -v -t "$SESSION:dash"    'tail -f /var/log/forge/health.log'
tmux select-layout -t "$SESSION:dash" even-vertical >/dev/null
echo "dashboard built: $SESSION:dash ($(tmux list-panes -t "$SESSION:dash" | wc -l | tr -d ' ') panes)"
EOF
sudo chmod +x /usr/local/bin/forge-dash
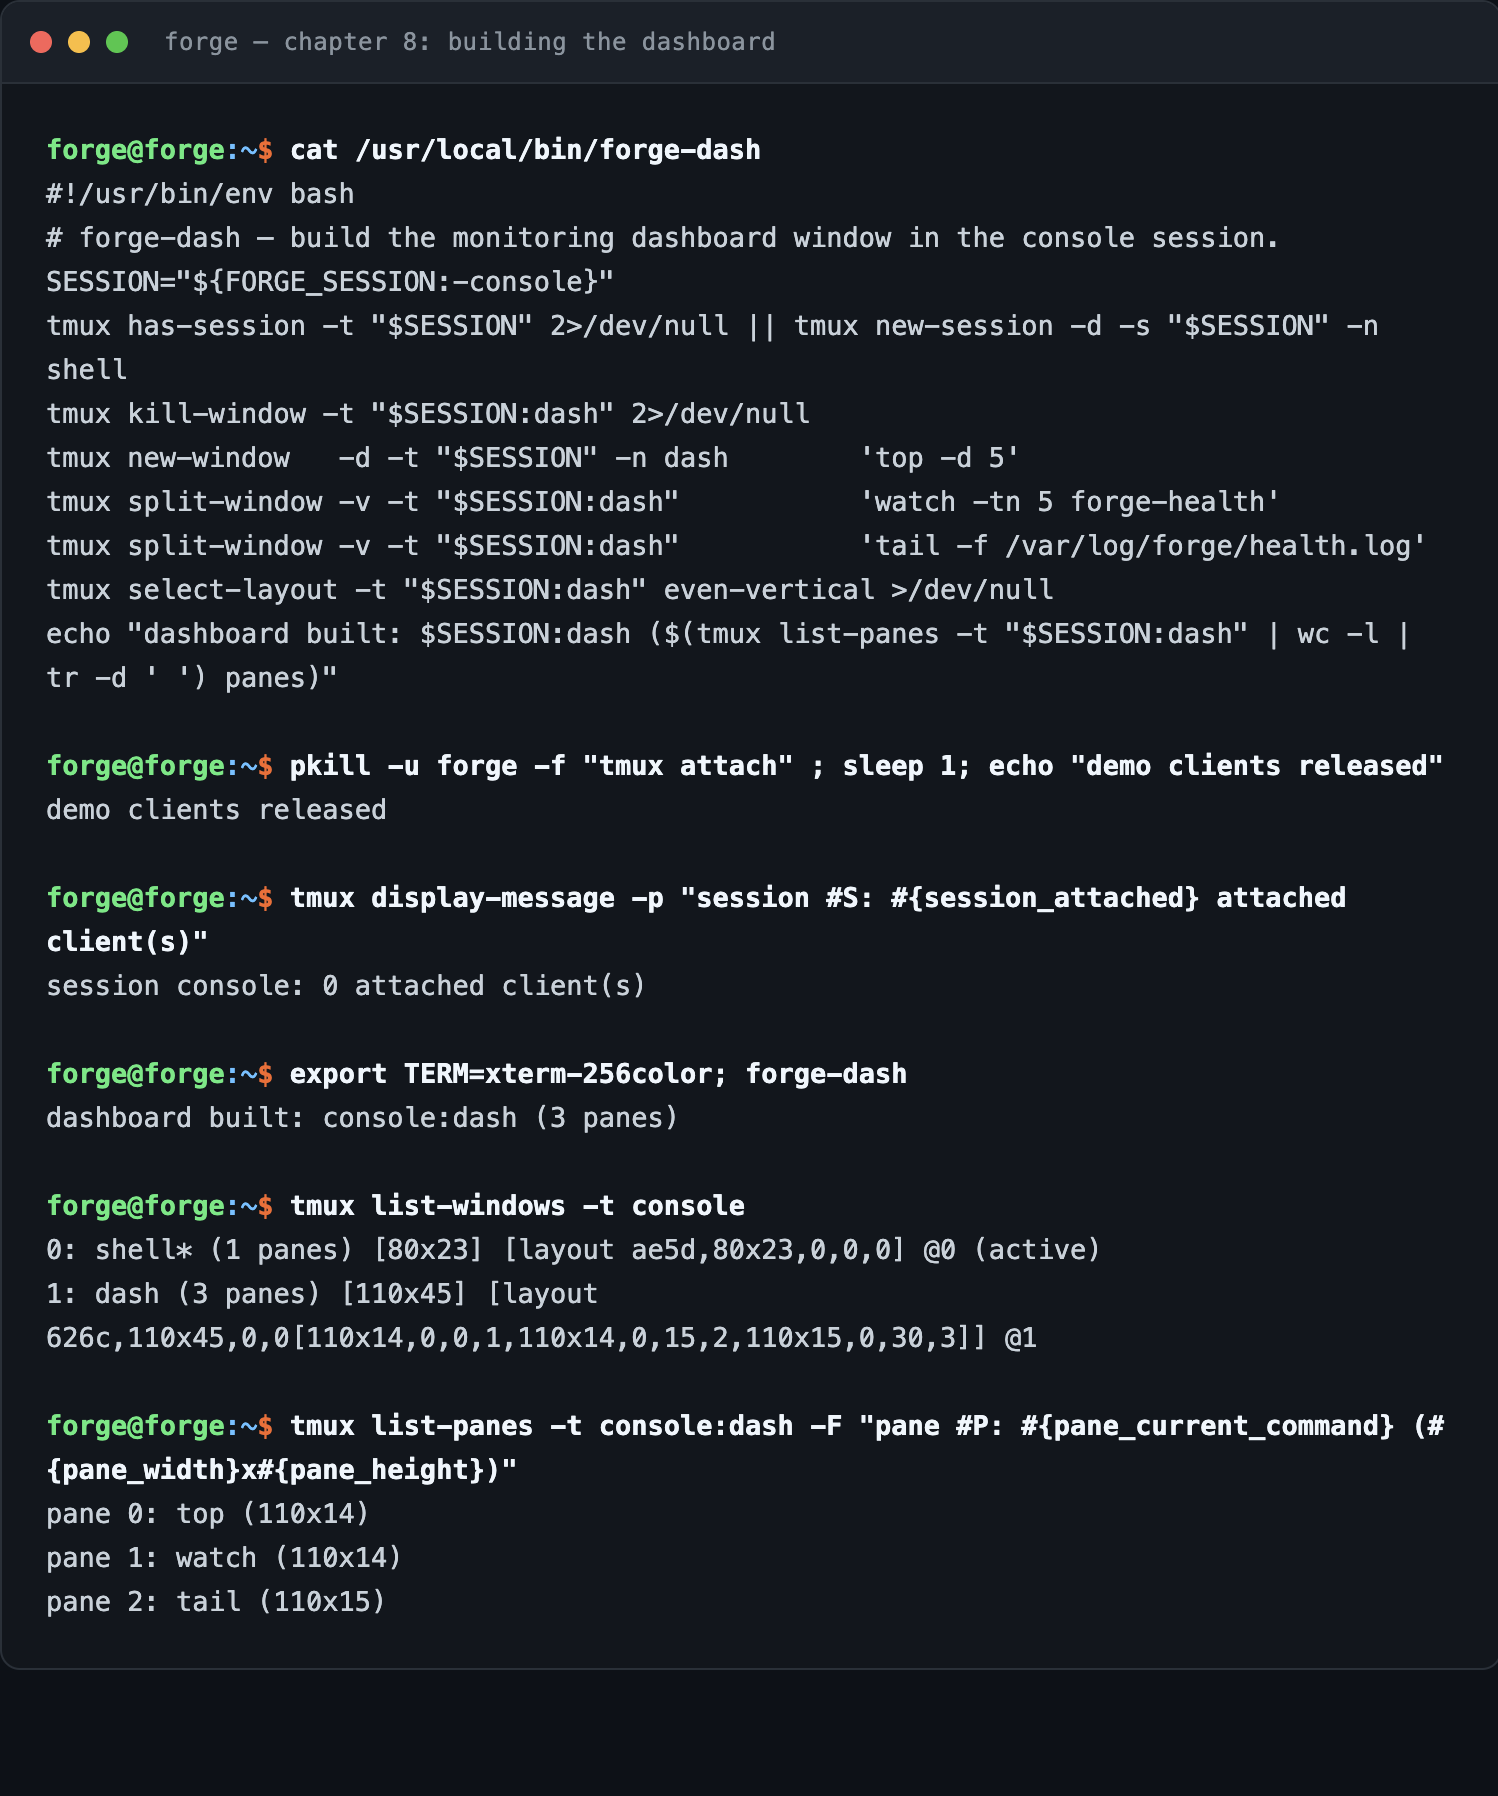
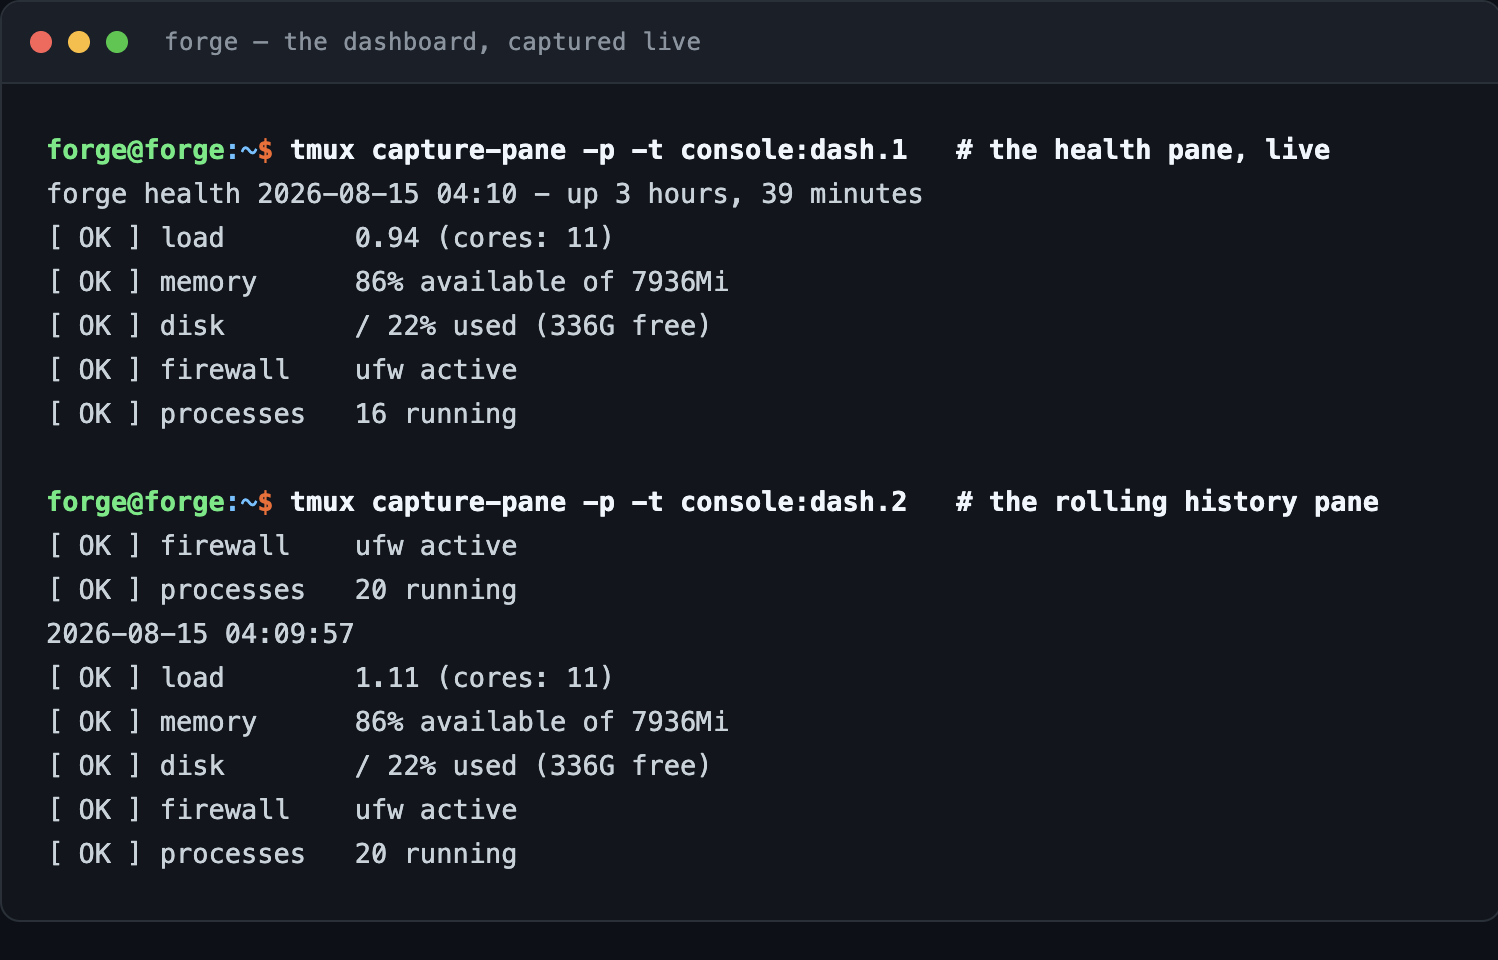
Panes are sized by tmux, not by you: releasing the two 80x24 demo clients let the dash window take the session’s full 110x45, giving each pane fourteen usable rows instead of seven. Capture the live panes to prove the dashboard is actually running rather than merely built:
tmux capture-pane -p -t console:dash.1     # the health pane
tmux capture-pane -p -t console:dash.2     # the rolling history pane
And log history, so you can answer when did this start? rather than only what is wrong now?
sudo install -d -o "$USER" /var/log/forge
# every 5 minutes, append a timestamped, colour-stripped snapshot
( crontab -l 2>/dev/null; echo '*/5 * * * * { date "+\%Y-\%m-\%d \%H:\%M:\%S"; /usr/local/bin/forge-health | sed "s/\x1b\[[0-9;]*m//g" | tail -n +3; echo; } >> /var/log/forge/health.log' ) | crontab -
🔍 Knowledge Check: The Watchtower
- Why did the firewall check report a different verdict on the dashboard than in your shell?
- What question can the health log answer that the health screen cannot?
🧙♂️ Chapter 9: The Watchtower’s Eye - btop and Its Discontents
⚔️ Skills You’ll Forge in This Chapter
- Replacing
topwith an instrument that shows history, not just an instant - Diagnosing the two ways btop refuses to run, both of which you will hit
top answers “what is happening right now”. It cannot answer “was this spike big, and is it over?” - and on a server, that second question is the one you actually have. btop draws a rolling history graph, a meter per core, memory and disk gauges, and a sortable process list, all at once.
sudo apt-get install -y btop
btop
Configure it once, per user, at ~/.config/btop/btop.conf:
graph_symbol = "block"     # braille is prettier in a terminal, blocks are safer (see below)
theme_background = False   # inherit your terminal's background instead of painting its own
update_ms = 1000           # once a second is plenty for a box you are not staring at
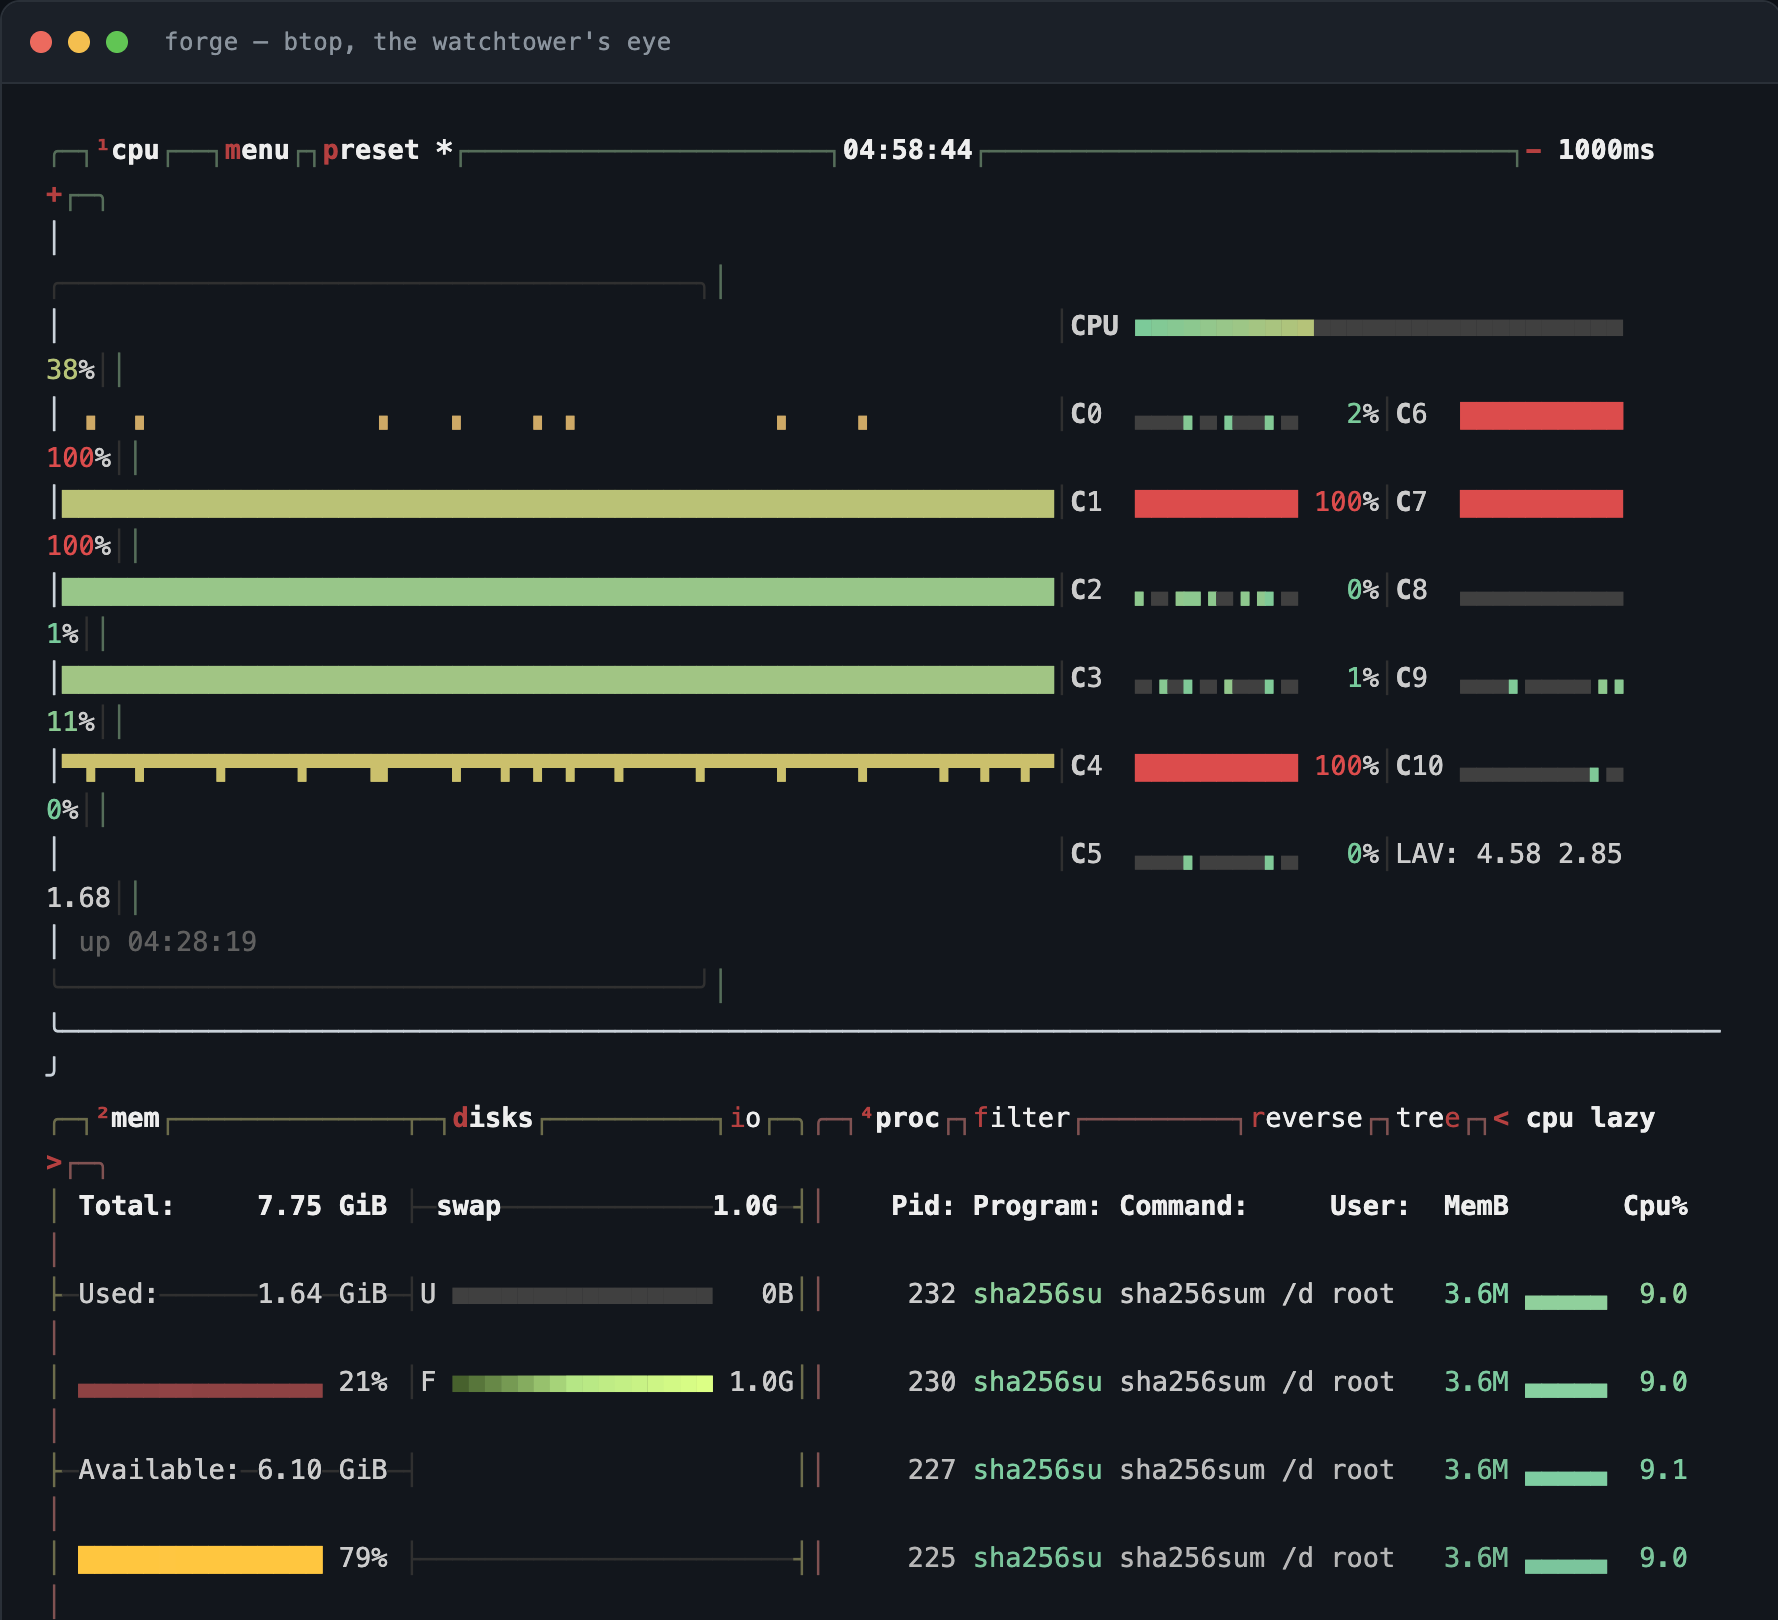
That capture is btop under real load - four sha256sum processes were pinning cores while it ran, which is why the history graph has shape and several cores read 100%.
🔮 The Two Refusals
btop is opinionated about terminals, and it fails loudly rather than degrading. Both of these came up while building this quest.
Refusal one: no measurable terminal. Launch btop from a script, a cron job, or anything without a real pty and it dies immediately:
ERROR: Failed to get size of terminal!
It is not asking for a big terminal, it is asking for any terminal it can measure. If you want btop-like data without a terminal, you want btop --utf-force inside a tmux pane - or a different tool entirely, because btop is a viewer, not a collector.
Refusal two: a pane too small. btop needs at least 80x24. Split a 45-row window three ways evenly and each pane gets 14 rows, so the dashboard you built in Chapter 8 greets you with this instead of a graph:
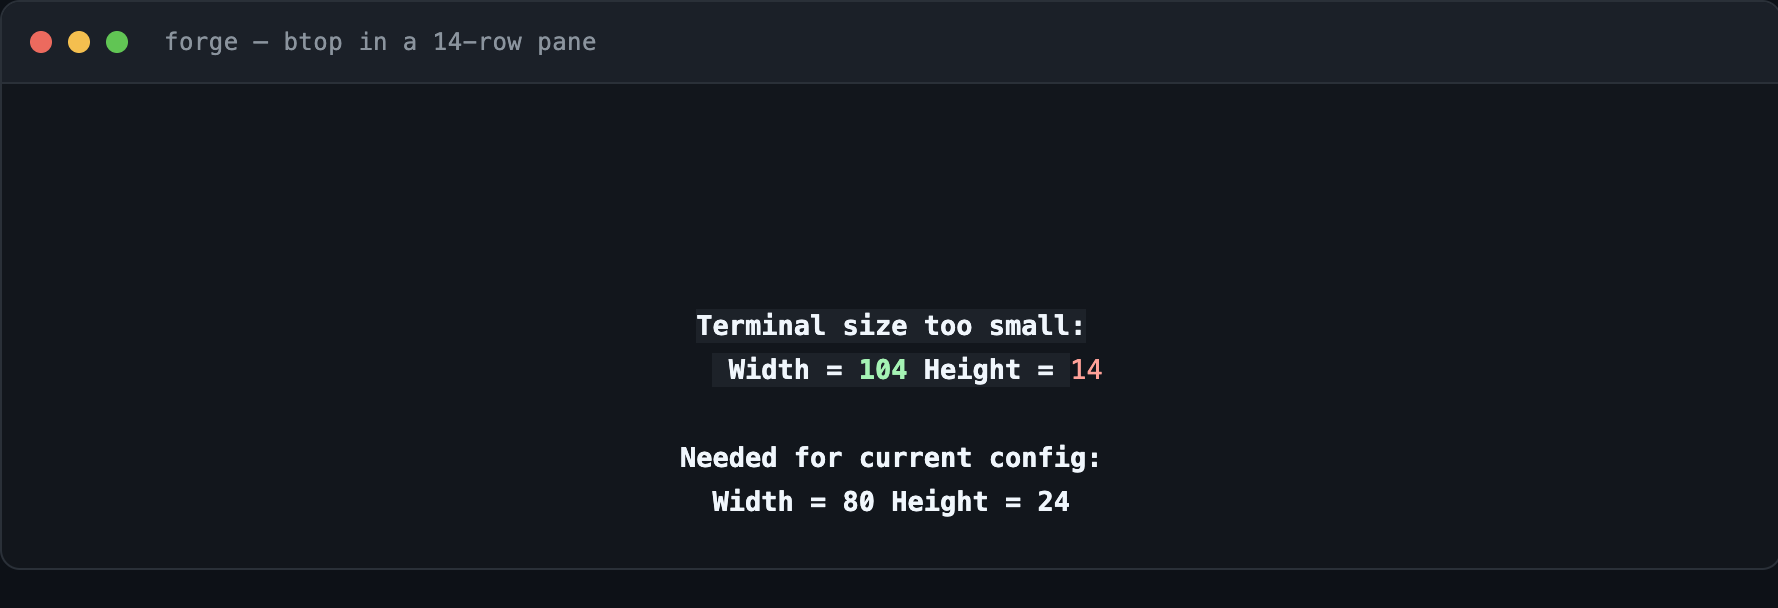
The fix is to stop splitting evenly and give the instrument the room it asks for. Sizes, not fractions:
# btop keeps the top ~28 rows; health and history share the rest
tmux new-window   -d -t console -n dash 'btop --utf-force'
tmux split-window -v -t console:dash.0 -l 17 'watch -tn 5 forge-health'
tmux split-window -v -t console:dash.1 -l 8  'tail -f /var/log/forge/health.log'
tmux list-panes   -t console:dash -F 'pane #P: #{pane_current_command} (#{pane_width}x#{pane_height})'
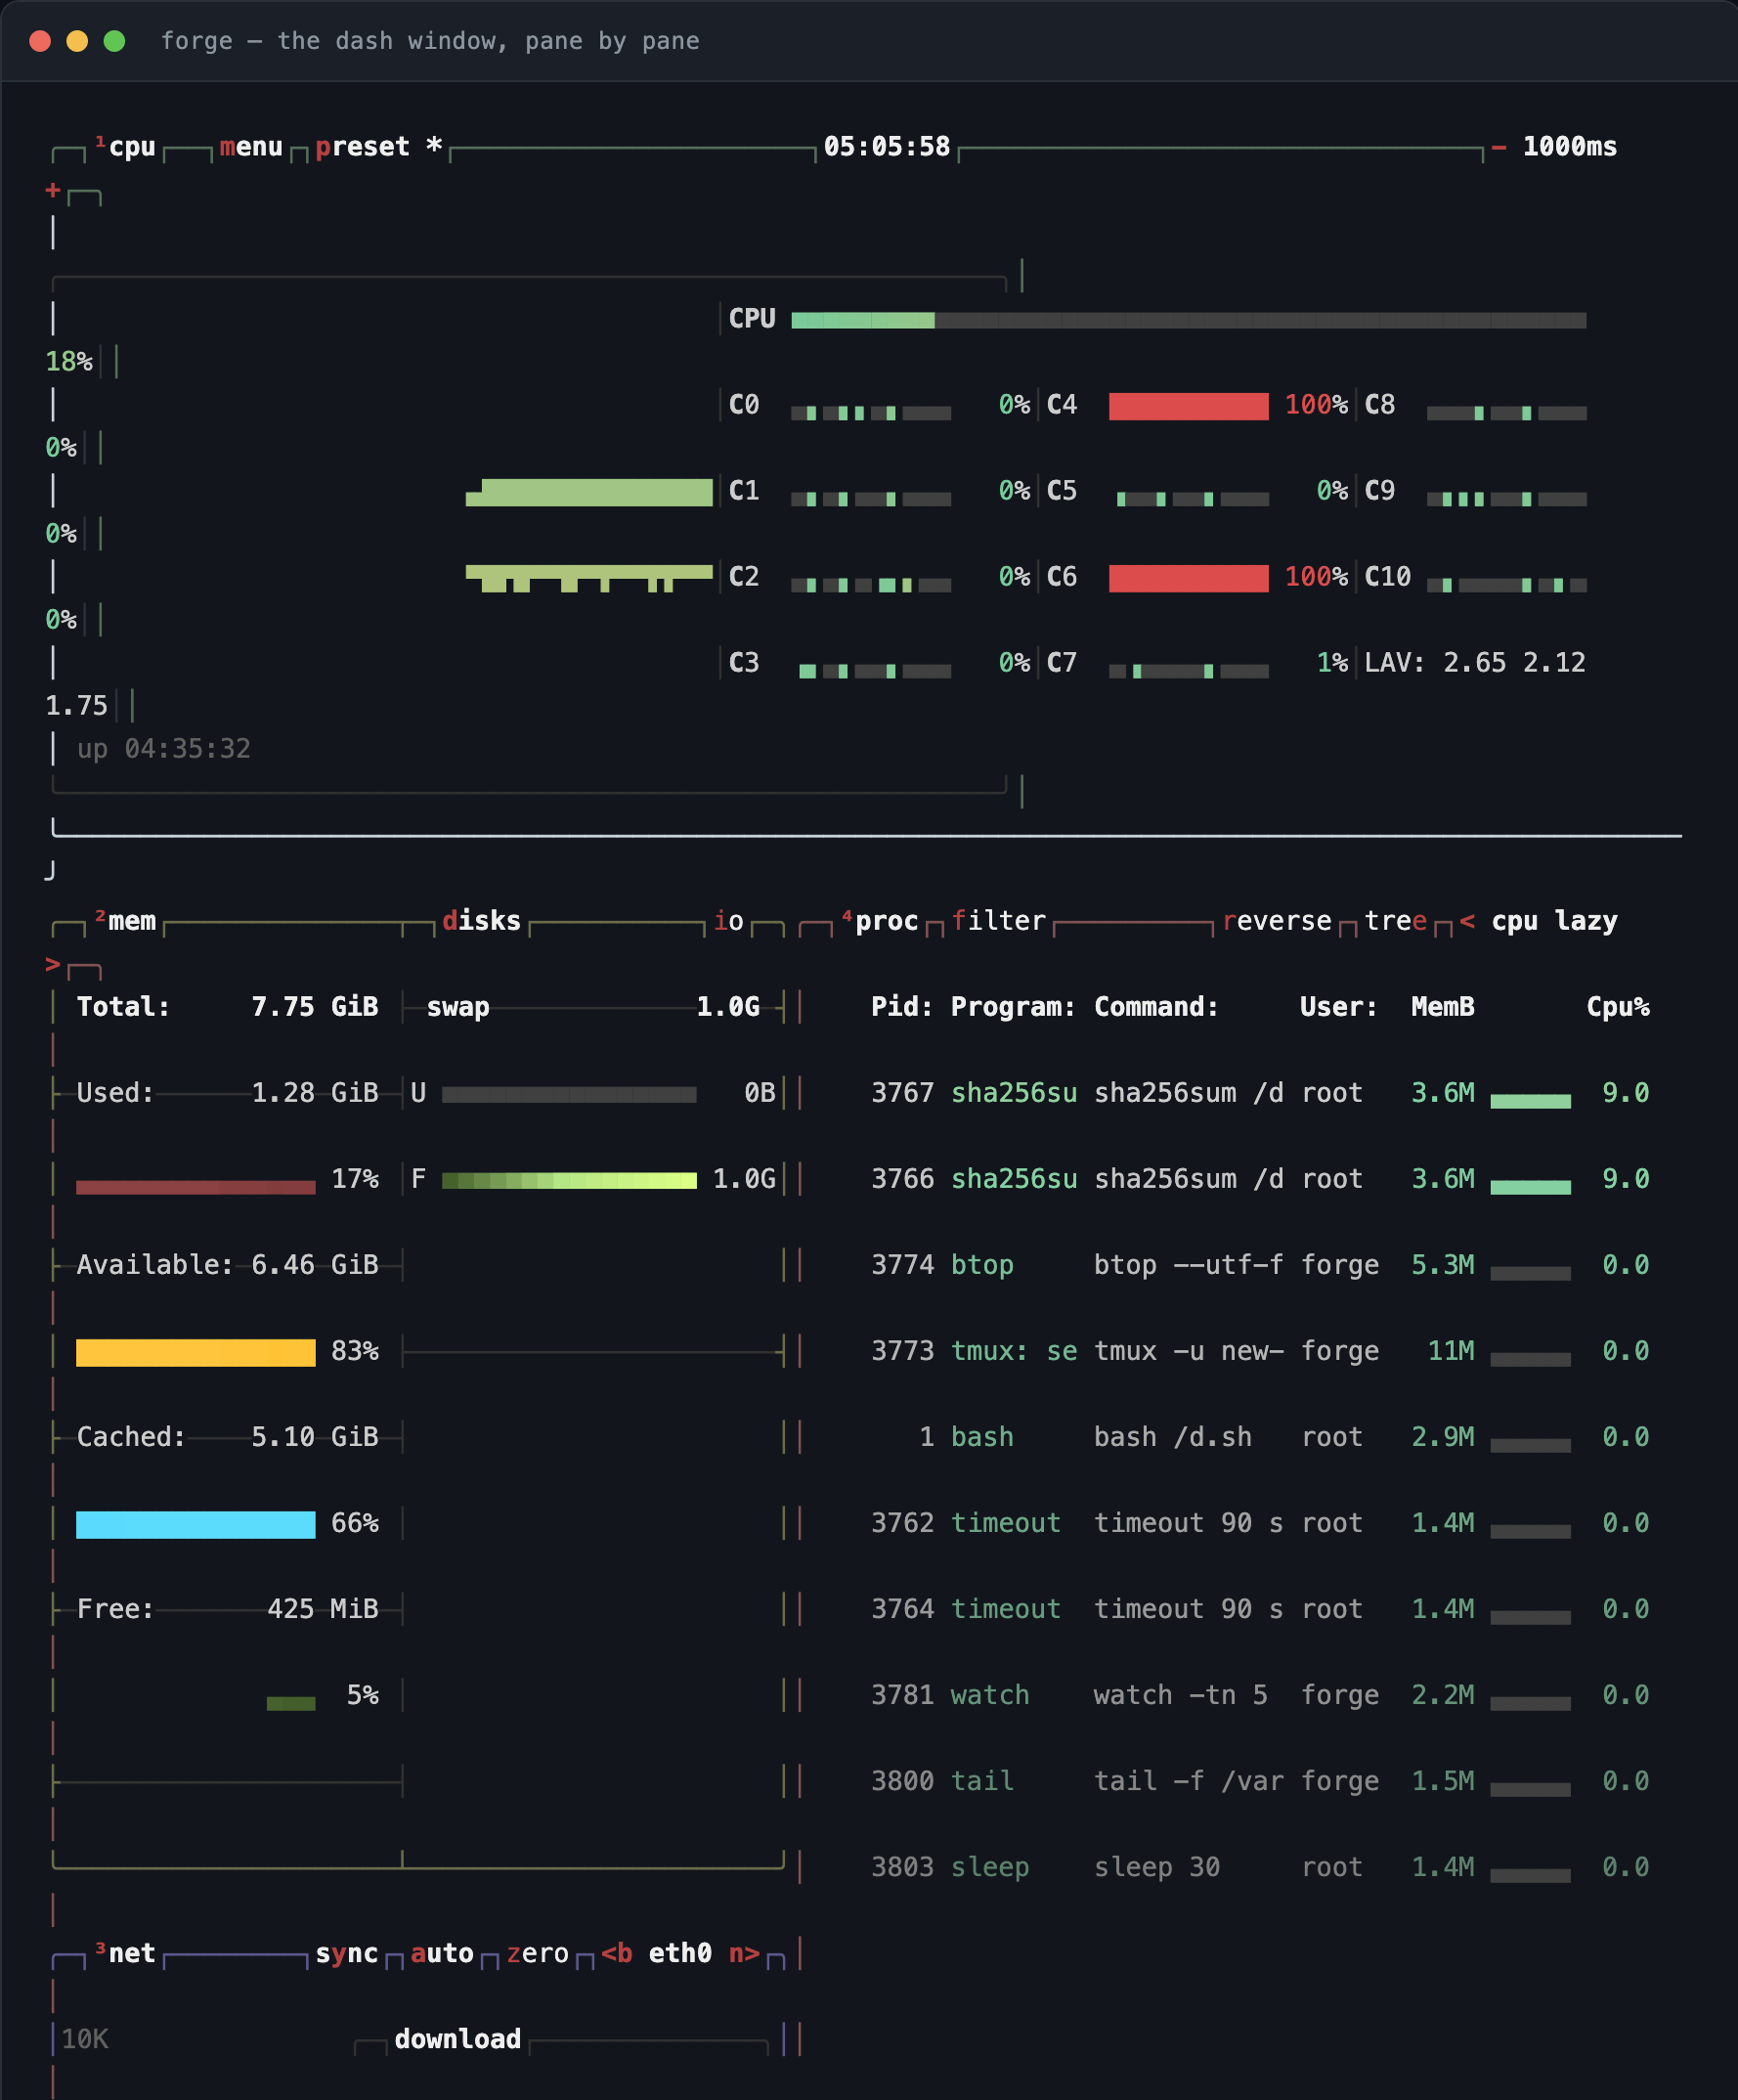
Those are the same three panes as Chapter 8, captured one after another - 28 rows for btop, 8 each for the health verdict and the rolling log.
⚠️ The sizing trap from Chapter 7 returns here. tmux sizes a window to its smallest attached client, so a forgotten 80x24 session on another machine silently shrinks the monitor’s dashboard until btop refuses to draw. If btop worked yesterday and not today, run
tmux list-clientsbefore you touch the config - the culprit is usually a stale client, not btop.
glances is worth knowing as the alternate view: one screen covering CPU, memory, network, disks, sensors and containers, and it can serve that same view over HTTP with glances -w - useful on a box whose monitor you cannot see from where you are sitting.
🔍 Knowledge Check: The Watchtower’s Eye
- What question does a history graph answer that a snapshot cannot?
- Your dashboard shows “Terminal size too small” - name two different causes and how you would tell them apart.
🧙♂️ Chapter 10: The Operator’s Toolkit - TUIs for Services, Disks, and Repos
⚔️ Skills You’ll Forge in This Chapter
- Installing tools that ship as release tarballs rather than Debian packages
- Driving containers, repositories and disk usage without memorising flags
Not every good tool is a .deb. lazygit and lazydocker ship as GitHub release tarballs, so fetch them with a small reusable function rather than copying a URL out of a browser:
gh_install() {                       # gh_install <owner/repo> <binary> <asset-pattern>
  local repo="$1" bin="$2" pat="$3" ver url
  ver=$(curl -fsSL "https://api.github.com/repos/$repo/releases/latest" \
        | grep -m1 '"tag_name"' | sed -E 's/.*"v?([^"]+)".*/\1/')
  url="https://github.com/$repo/releases/download/v${ver}/${pat//VER/$ver}"
  curl -fsSL "$url" -o "/tmp/$bin.tgz"
  sudo tar -xzf "/tmp/$bin.tgz" -C /usr/local/bin "$bin"
  echo "$bin $ver installed"
}
ARCH=$([ "$(dpkg --print-architecture)" = arm64 ] && echo arm64 || echo x86_64)
gh_install jesseduffield/lazygit    lazygit    "lazygit_VER_Linux_${ARCH}.tar.gz"
gh_install jesseduffield/lazydocker lazydocker "lazydocker_VER_Linux_${ARCH}.tar.gz"
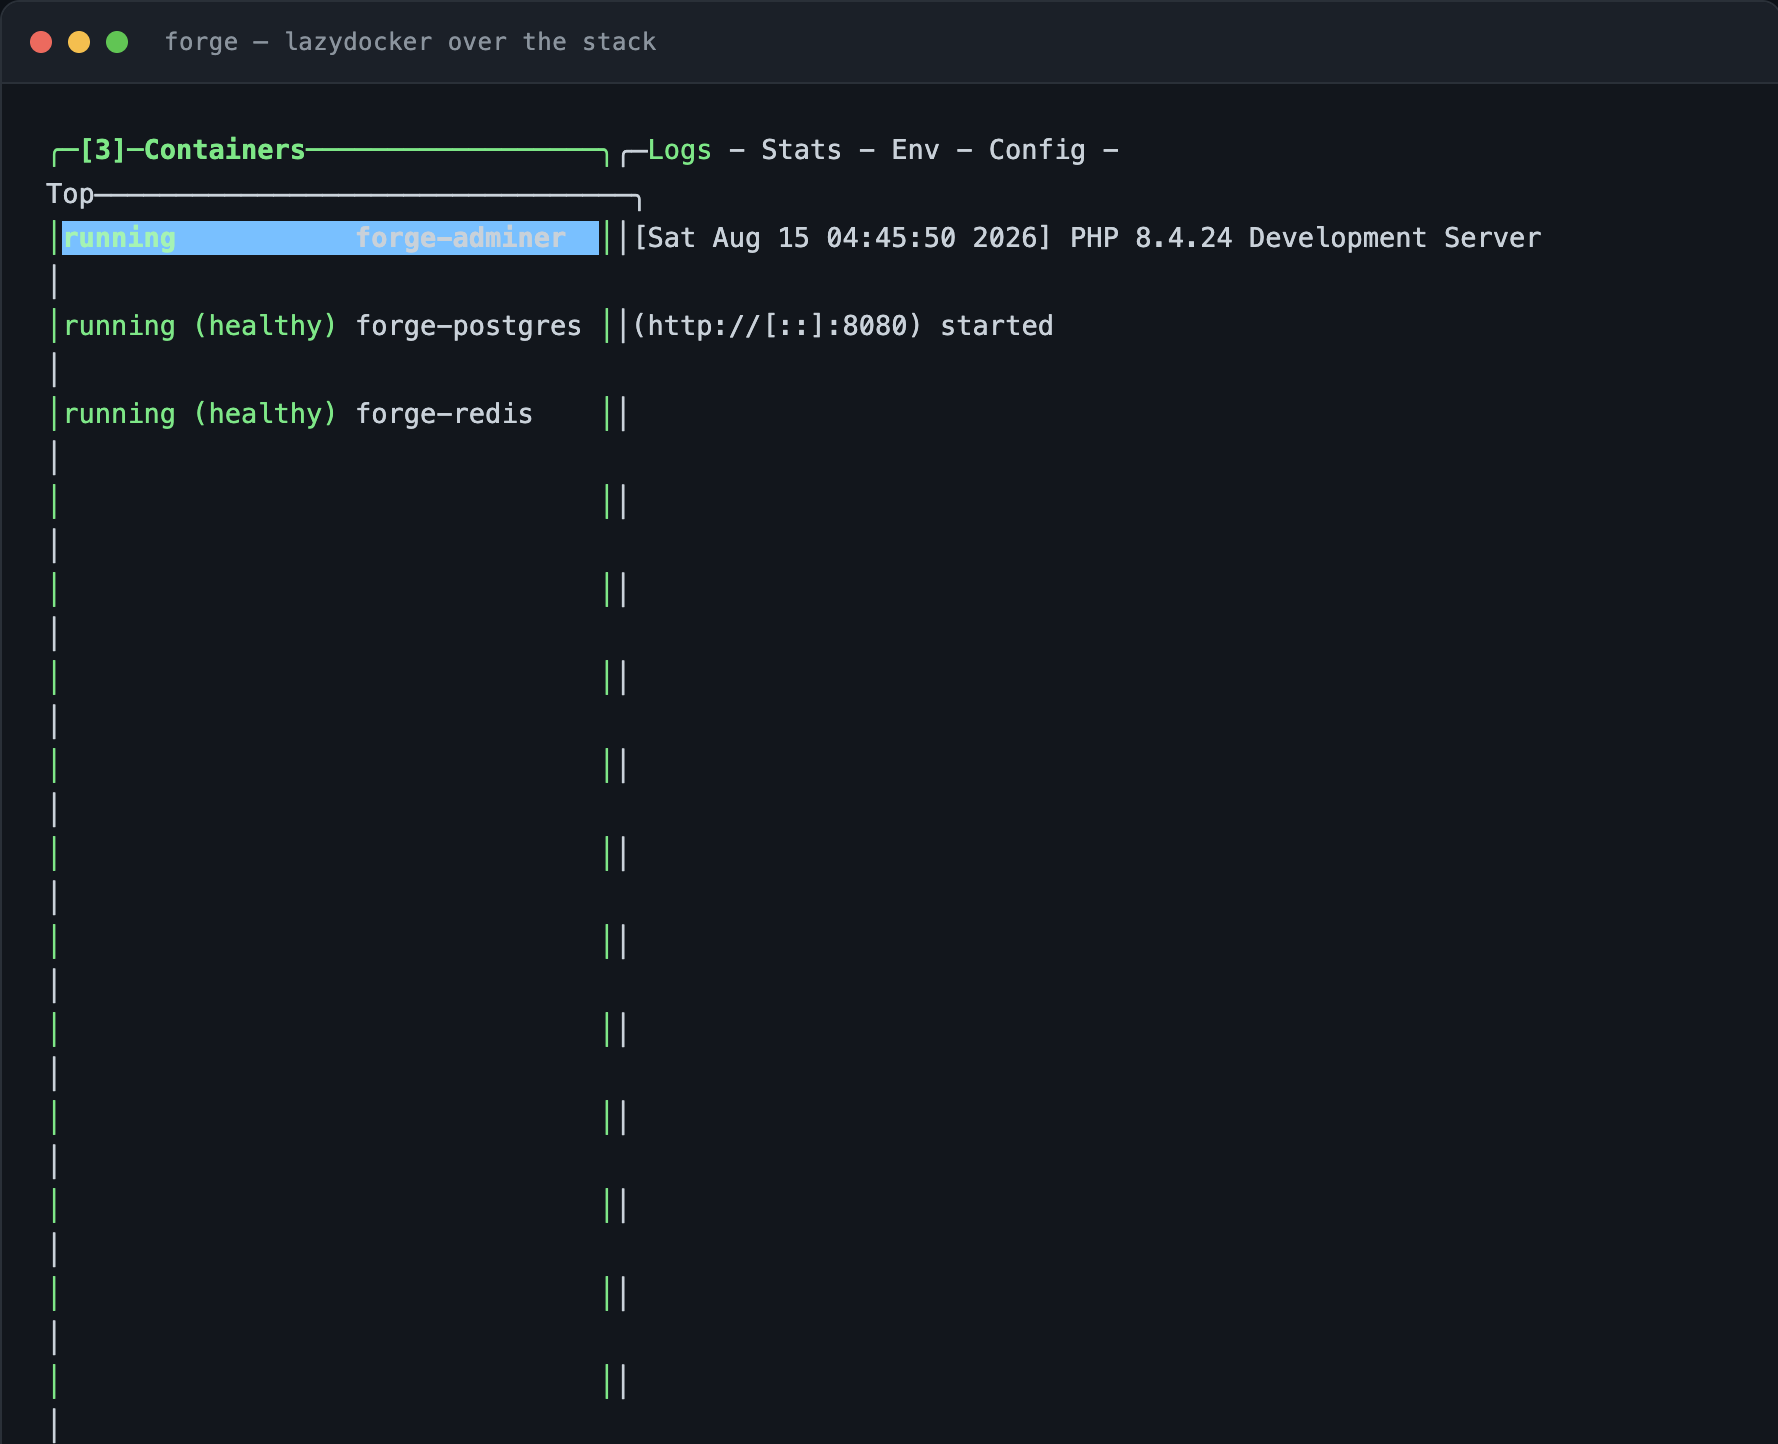
lazydocker turns the stack from Chapter 6 into something you can steer: containers with health state, live logs, stats, and restart or shell access on a keystroke.
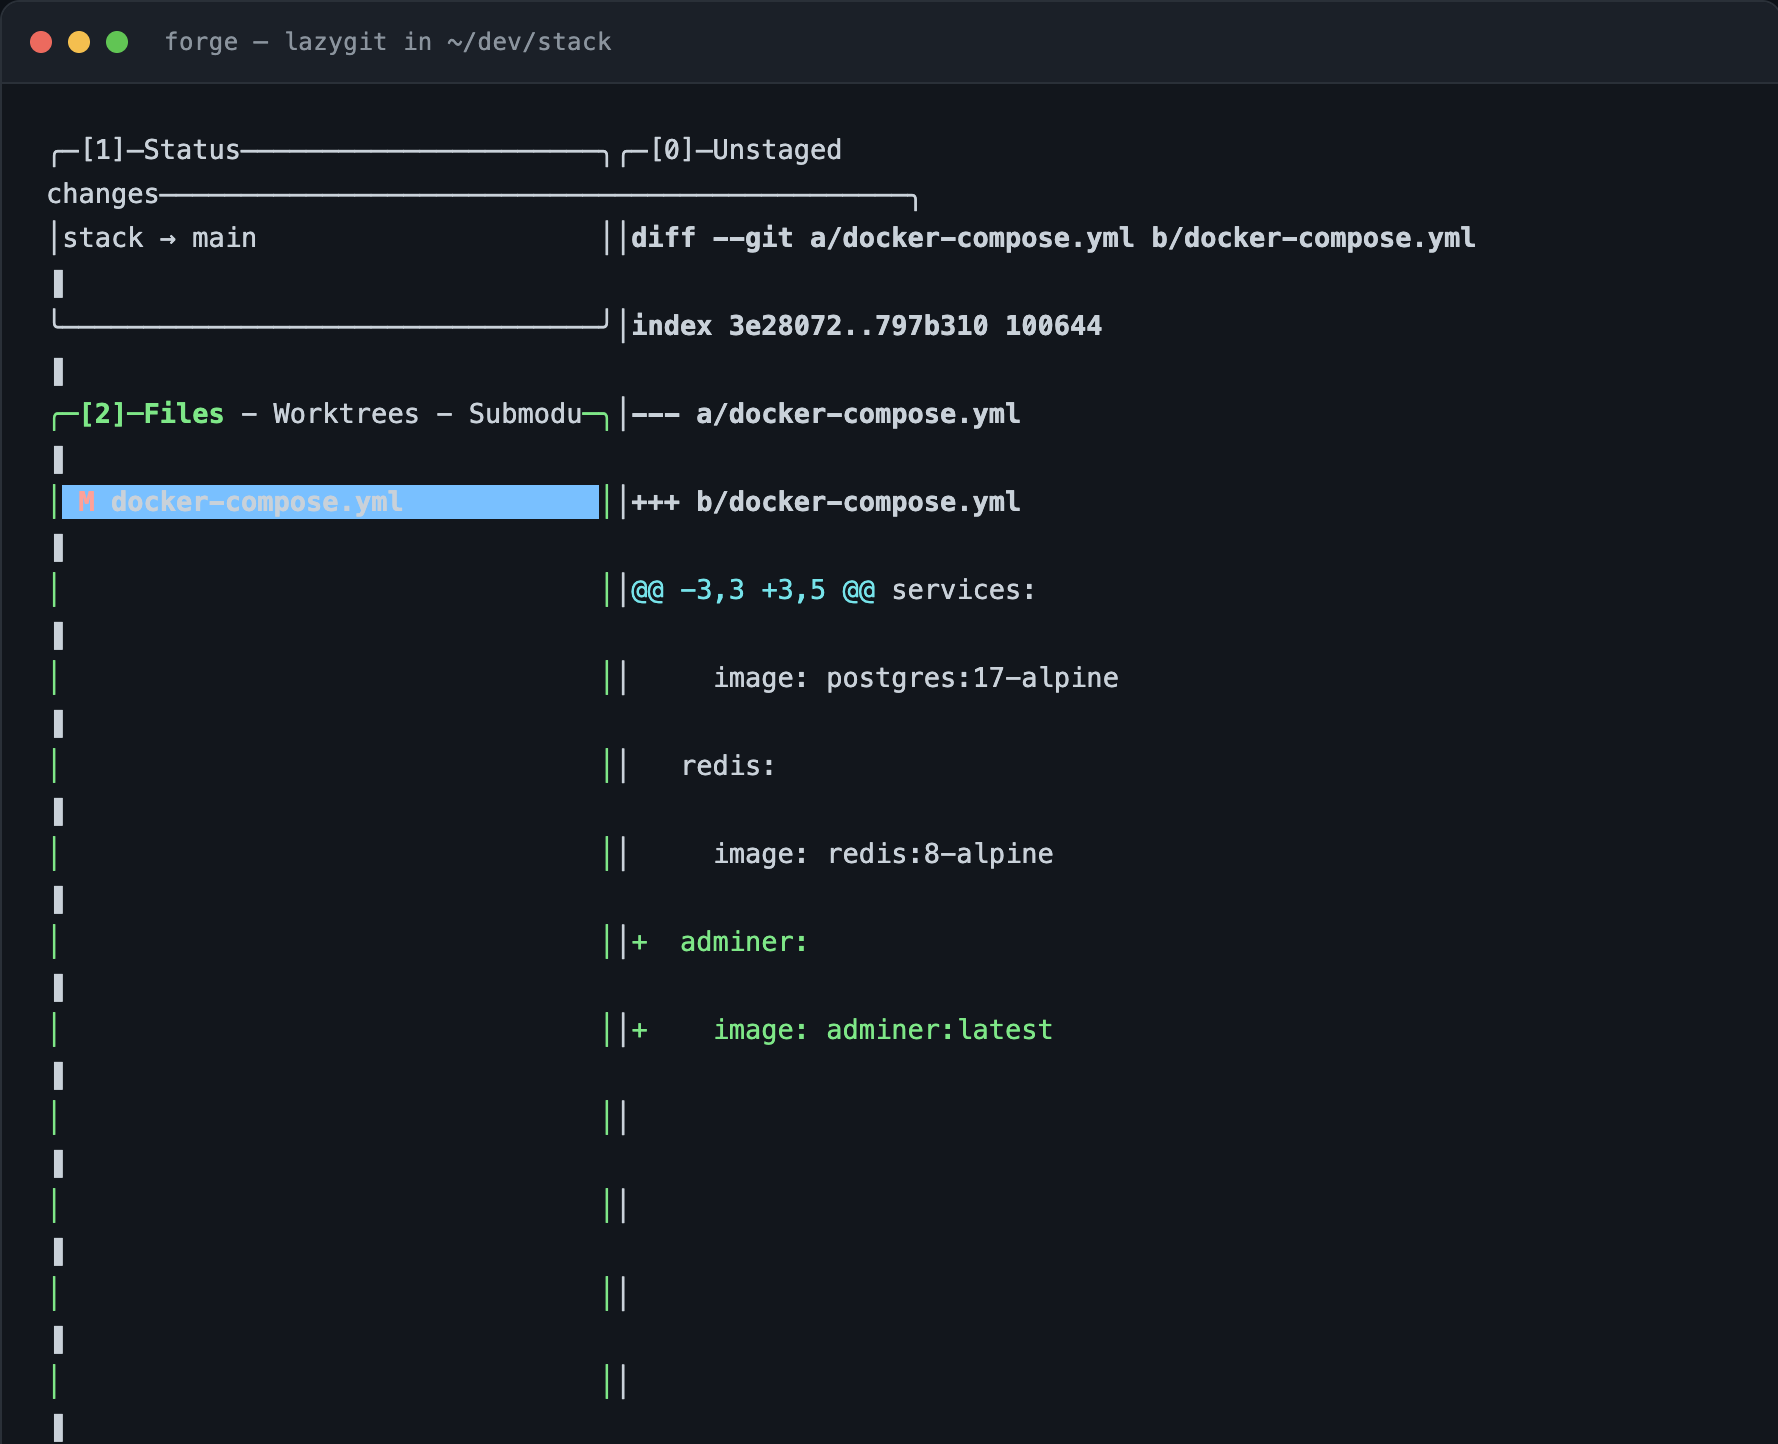
lazygit does the same for repositories, which matters because a dev server accumulates them. Staging hunks, rewording commits, and reading a diff are all one key away.
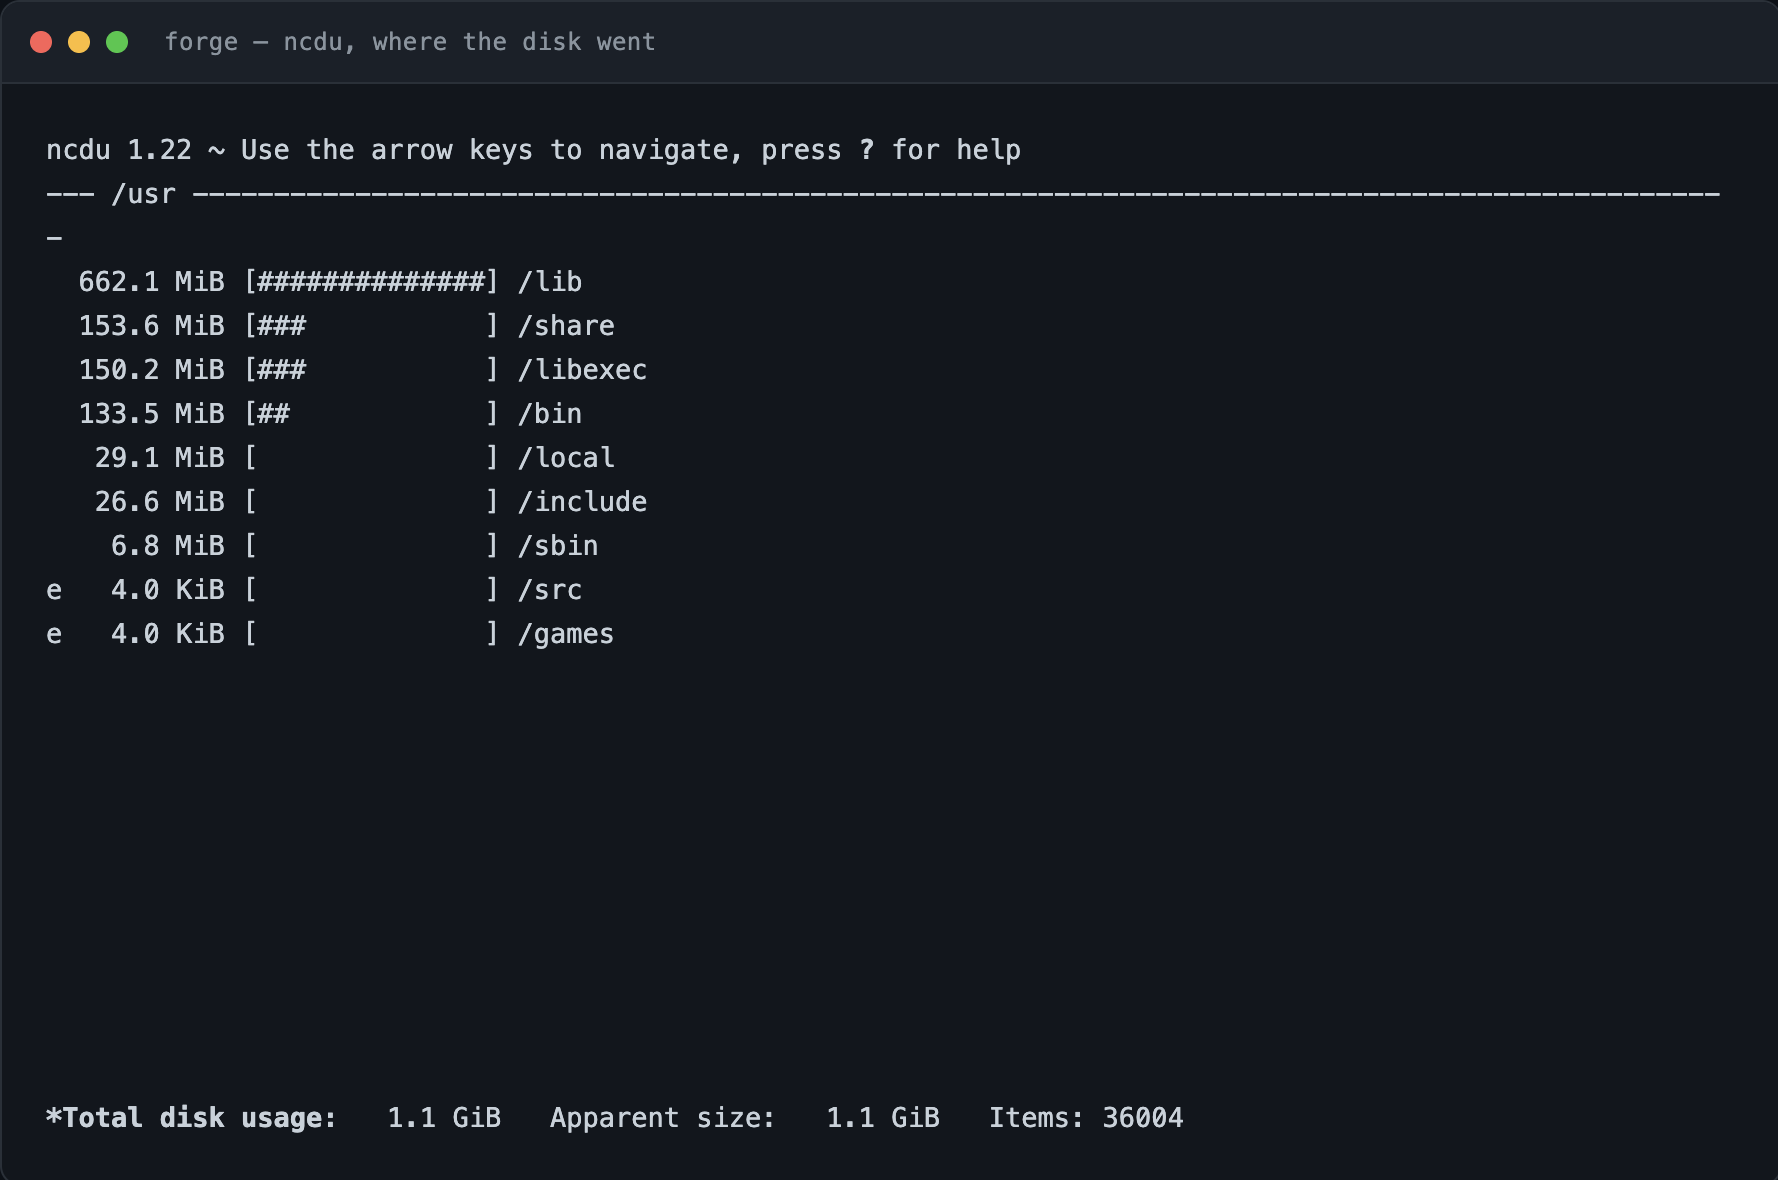
ncdu answers the question every server eventually asks you: where did the disk go? It walks a tree once and sorts by size, so you can descend into the guilty directory instead of guessing.
sudo apt-get install -y ncdu duf
ncdu /usr        # navigate with arrows, delete with d, quit with q
duf              # a friendlier df: one table, colour-coded, per-filesystem
Finally, the small daily replacements. eza lists files with git status inline; bat is cat with syntax highlighting and line numbers; fzf turns any list into a fuzzy search; zoxide learns the directories you actually visit.
sudo apt-get install -y eza bat fzf zoxide
cat >> ~/.zshrc <<'EOF'
alias ls='eza --git --group-directories-first'
alias cat='batcat --style=plain'     # Debian ships bat as batcat
eval "$(zoxide init zsh)"            # then `z stack` jumps to ~/dev/stack
source /usr/share/doc/fzf/examples/key-bindings.zsh   # Ctrl-R history, Ctrl-T files
EOF
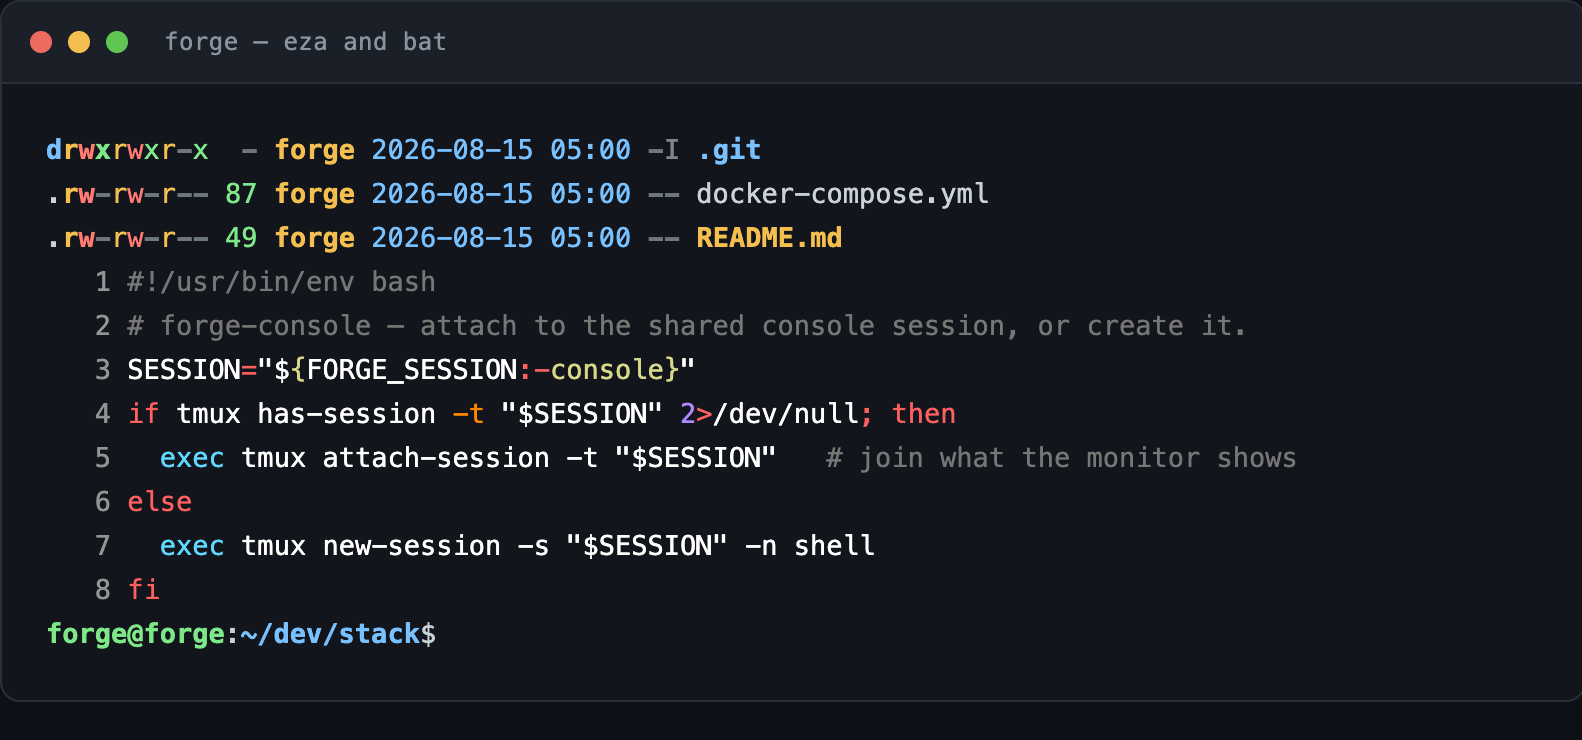
The
batcatandfdfindrenames are not a mistake. Debian shipsbatandfdunder alternate names to avoid colliding with existing packages. Alias them and move on - but remember the real names when you write a script that must run on a machine without your dotfiles.
🔍 Knowledge Check: The Operator’s Toolkit
- Why does
gh_installresolve the version from the API instead of hard-coding a URL? catis aliased tobatcatin your shell - why might that break a script, and what protects you?
🎮 Mastery Challenges
🟢 Novice Challenge: Prove the Box
Run a single verification pass and capture the output. Every line should be something you can explain.
hostname && whoami
node --version; uv --version; rustc --version
sudo -n ufw status | head -2
tmux ls
forge-health
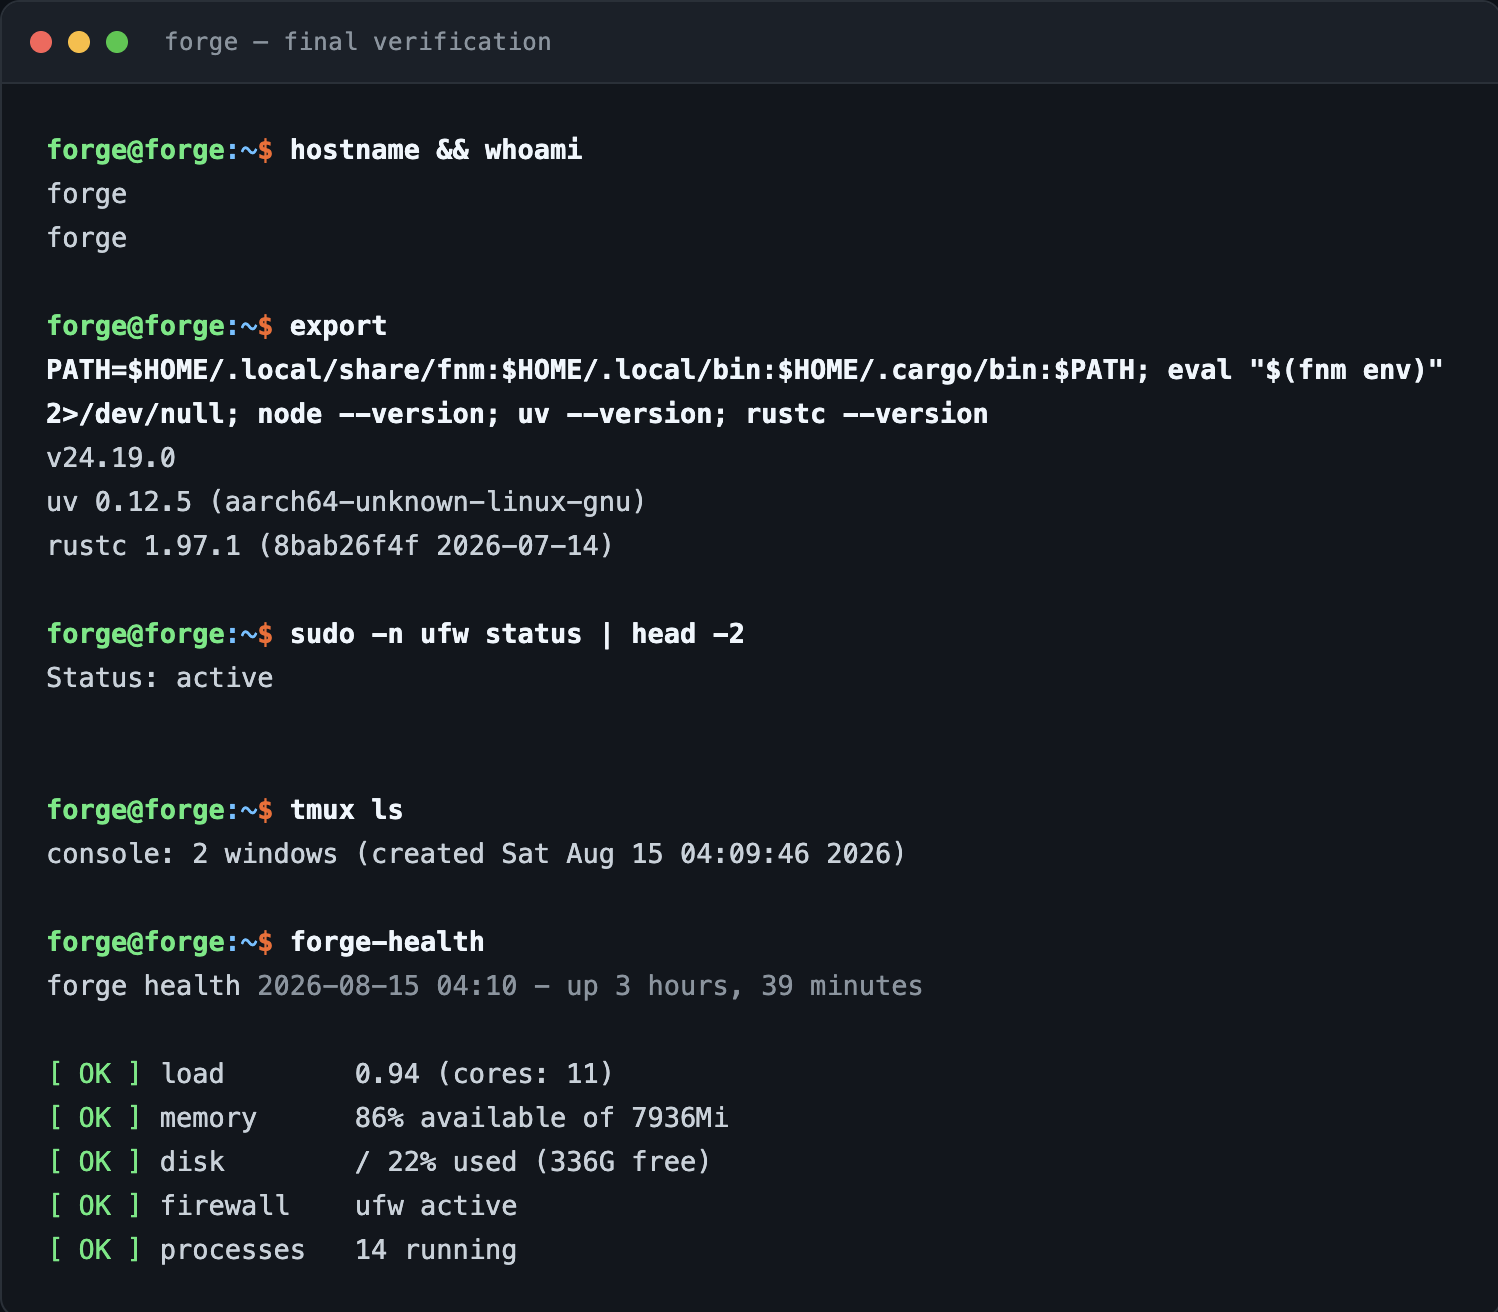
Success Criteria:
- The hostname is the one you chose, and
sudono longer warns about resolving it - All three toolchains answer with versions
- The firewall reports
Status: active forge-healthreports noCRITlines
🟡 Intermediate Challenge: Add a Check
Add a swap check and a container count check to forge-health, then watch them appear on the dashboard without restarting anything.
Success Criteria:
- The new checks use the same
ok/warn/critverdict helpers - The container check degrades gracefully when Docker is not running
- The dashboard pane shows both within one refresh interval
🔴 Advanced Challenge: Rebuild From Scripts
Turn everything you ran into four idempotent scripts - 01-system.sh, 02-user.sh, 03-console.sh, 04-dashboard.sh - then prove they are idempotent by running them twice on the same box, and prove they are complete by running them on a second machine.
Success Criteria:
- A second run changes nothing and reports no errors
- A fresh machine reaches an identical state with no manual steps
- Each script logs to
~/setup/logs/so a failed run can be diagnosed after the fact
🏆 Quest Rewards & Achievements
- 🏆 Forgemaster of the Home Realm - you provisioned a bare machine into a working development server
- 🔭 Keeper of the Watchtower - you built health checks and a dashboard for a machine you own
- 🔬 Instrument Adept - you read the machine through btop, lazydocker, lazygit and ncdu rather than guessing
- ⚡ Skills unlocked: end-to-end Linux provisioning, host firewalling, SSH hardening, per-user toolchains, container service stacks, tmux session sharing, self-authored monitoring, TUI-driven operations
- 📈 +100 progression points toward the Expert tier
🗺️ Next Steps in Your Journey
- Monitoring Fundamentals - graduate from a health script to metrics, retention, and alerting
- Infrastructure as Code - describe this machine declaratively instead of by hand
- Cloud Computing Fundamentals - compare what you built to what a provider rents you
Character Class Recommendations
- 🛡️ Security Specialists - extend the perimeter chapter with fail2ban, auditd, and key rotation
- ⚙️ DevOps Engineers - drive the whole build from Ansible and diff it against these scripts
- 📊 Data Engineers - the Postgres in Chapter 6 is a real warehouse target for later quests
graph LR
    Bash[Bash Scripting] --> Forge[🏰 Forge Your Own Dev Server]
    Compose[Docker Compose Orchestration] --> Forge
    Forge --> Monitor[Monitoring Fundamentals]
    Forge --> IaC[Infrastructure as Code]
📚 Resources
Official Documentation
- Debian Administrator’s Handbook - the canonical reference for everything in this quest
- ufw manual - every rule form, including the LAN scoping used here
- OpenSSH sshd_config reference - what each hardening directive actually does
- tmux manual - sessions, windows, panes, clients, and formats
- Docker Compose specification - health checks and restart policies
The Instruments
- btop - the system monitor from Chapter 9, including its config reference
- glances - the alternate one-screen view, with a built-in web server
- lazydocker and lazygit - the container and repository TUIs
- ncdu and duf - disk usage, interactively and at a glance
- eza, bat, fzf and zoxide - the daily replacements
Learning Materials
- fnm, uv, and rustup - the three toolchain managers installed here
- Arch Wiki: Security - distribution-agnostic hardening reference
🤝 Quest Completion Checklist
- The machine answers to a name you chose, in both
/etc/hostnameand/etc/hosts - Your user exists, has validated sudo rights, and logs in with an SSH key
ufw status verboseshows default-deny with LAN-scoped rules you can explain- Node, Python, and Rust answer with versions from per-user installs
docker compose psshows the stack healthy and it survives a reboot- The monitor and your SSH session share one tmux console
forge-healthreports verdicts, the dashboard refreshes them, and history lands in/var/log/forge/- btop runs in a pane tall enough to draw, and you can explain both of its refusals
- lazydocker, lazygit and ncdu are installed and answer for the stack, your repos, and your disk
- The whole build exists as scripts you could run again tomorrow
🕸️ Knowledge Graph
Structured wiki-links connect this quest to the IT-Journey knowledge graph. Open the Obsidian Graph View to explore connections.
Level hub: [[Level 1000 (8) - Cloud Computing]] Overworld: [[🏰 Overworld - Master Quest Map]] Prerequisites: [[Bash Scripting: Automation Fundamentals]] Unlocks: [[Monitoring Fundamentals: Observability Essentials]] Related: [[Infrastructure as Code: Terraform Fundamentals and State]]
🎁 Rewards
Badges
- 🏆 Forgemaster of the Home Realm - Provisioned a bare machine into a working dev server
- 🔭 Keeper of the Watchtower - Built a live health dashboard for a machine you own
- 🔬 Instrument Adept - Reads a machine through btop and a toolkit of purpose-built TUIs
Skills unlocked
- 🛠️ End-to-end Linux provisioning
- 🛡️ Host firewall and SSH hardening
- 🔭 Self-authored health checks and dashboards
- 🔬 Terminal instrumentation and TUI-driven operations
Features unlocked
- The on-premises counterpart to cloud provisioning, and the box you will run every later quest on
🕸️ Quest Network
Click a node to open the quest · ⌘/Ctrl-click for a new tab · drag to reposition · scroll to zoom.
Referenced by
- Loading…